Processing Visualizer
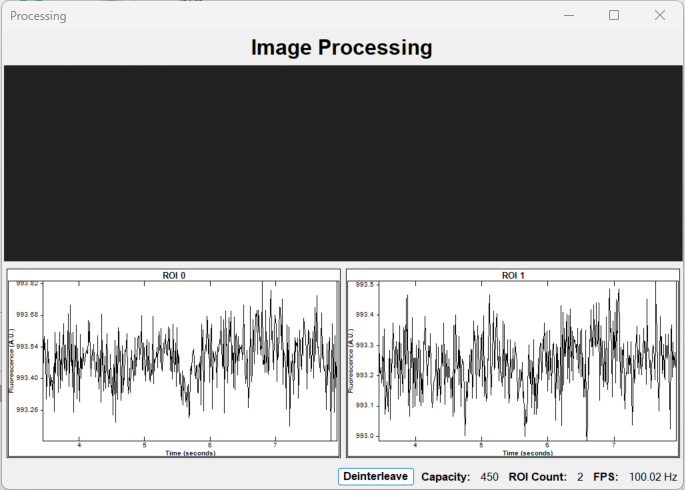
Double clicking the Processing node while the workflow is running opens up the Processing Visualizer. This visualizer displays the live image coming from the camera as well as a rolling graph for each defined ROI.
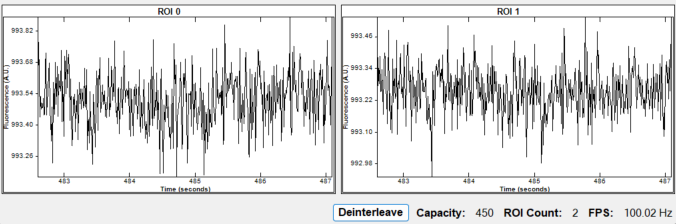
At the bottom of the window is a Deinterleave/Interleave button as well as values for the capacity of each graph, number of ROIs, and current frame rate.
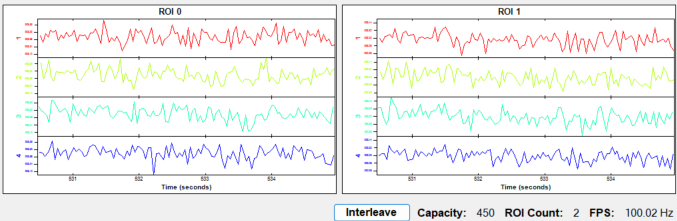
Clicking Deinterleave will change the view of each graph so that raw data is split up into the number of channels specified by the DeinterleaveCount property of the Processing node.
Clicking Interleave will bring the graphs back to the default view where the raw data is plotted in a single graph.