Abstract
The scientific author list has remained a linear, ordered sequence of names for over three centuries—despite radical changes in how research is conducted. This compression of multi-dimensional contributions into a one-dimensional ranking creates well-documented tensions: authorship disputes, gift authorship, invisibility of infrastructure contributors, and incentive structures that actively hinder collaborative team science. We present a multi-dimensional authorship framework that allows readers, institutions, and metrics systems to explore contributions along multiple axes simultaneously. Building on the CRediT (Contributor Roles Taxonomy) standard, our framework extends attribution with section-level contributions, project timelines, and rich author profiles. Critically, we reject the premise that any single author ordering is definitive—instead, the reader can dynamically re-sort by alphabetical order, CRediT roles, or project join date. This paper simultaneously describes the framework and serves as a live demonstration: the interactive authorship display and the contribution highlights embedded throughout this text illustrate how rethinking author display can bring transparency, reduce conflict, and properly credit the diverse contributions that make modern science possible.
Introduction
The author byline has served as the primary unit of academic credit for over three centuries. Despite radical transformation in how science is conducted—from the solitary natural philosopher to hundred-person collaborations spanning continents—the format of authorship attribution has remained essentially unchanged: a linear, ordered list of names.
This compression of multi-dimensional contributions into a one-dimensional sequence creates well-documented tensions. Early-career researchers depend on first-author publications for career advancement. Principal investigators expect last-author or corresponding-author designations to signal intellectual leadership. Middle authors—often including those who built critical infrastructure, contributed specialized techniques, or performed essential validation—receive minimal credit differentiation regardless of the significance of their contributions.
The consequences are not merely symbolic. Authorship disputes are among the leading causes of research misconduct complaints Rennie et al. (1997). Gift authorship and ghost authorship persist because the byline carries too much weight while communicating too little information Wren et al. (2007). Junior researchers report delaying publications and avoiding collaborations to protect their authorship position Sauermann & Haeussler (2017). The incentive structures that flow from linear author lists actively hinder the collaborative, interdisciplinary team science that modern challenges demand Wuchty et al. (2007).
We propose a fundamentally different approach. Rather than compressing contributions into a single ordered list, we present a multi-dimensional authorship framework that allows readers, institutions, and metrics systems to explore contributions along multiple axes simultaneously. The framework builds on the CRediT (Contributor Roles Taxonomy) standard while extending it with section-level contributions, project timelines, and rich author profiles. Critically, we reject the premise that any single ordering of authors is definitive—the reader can dynamically re-sort the author list by alphabetical order, number of CRediT roles, specific role contributions, or project join date.
This paper serves simultaneously as a description of the framework and as a live demonstration. The interactive authorship display above, and the contribution highlights embedded throughout this text, illustrate how rethinking author display can bring transparency, reduce conflict, and properly credit the diverse contributions that make modern science possible.
The CRediT Taxonomy
The Contributor Roles Taxonomy (CRediT), developed by the Consortia Advancing Standards in Research Administration Information (CASRAI) and first published in 2015 Brand et al. (2015), defines fourteen distinct contributor roles: Conceptualization, Methodology, Software, Validation, Formal Analysis, Investigation, Resources, Data Curation, Writing—Original Draft, Writing—Review & Editing, Visualization, Supervision, Project Administration, and Funding Acquisition. Each contributor can be assigned a degree of contribution—lead, equal, or supporting—for each applicable role.
CRediT has gained remarkable adoption. Over 5,000 journals now require or encourage CRediT disclosure McNutt et al. (2018), and major publishers including Elsevier, Springer Nature, and Cell Press have integrated CRediT into their submission workflows. The taxonomy has been particularly valuable for making visible the contributions of individuals whose work falls outside traditional “author” roles—data curators, software engineers, lab managers, and research administrators Allen et al. (2014).
However, CRediT adoption has not fundamentally changed how authorship is displayed. In most implementations, CRediT information appears as a static table at the end of the paper—an afterthought rather than a central organizing principle. The byline at the top remains unchanged: a linear list that implies a ranking. The rich contribution metadata exists but is structurally disconnected from the reading experience.
Limitations of Current Approaches
Current authorship display suffers from several interconnected limitations. First, the linear ordering implies a ranking that may not exist. In team science, contributions are often orthogonal: the person who built the data infrastructure, the person who designed the visualization, the person who wrote the theoretical framework, and the person who led the implementation each contribute indispensably but along entirely different dimensions. Compressing these into positions 1 through N forces a false hierarchy.
Second, the convention of “first author did most work” and “last author is the PI” is not universal. In mathematics, authors are traditionally listed alphabetically. In economics, ordering conventions vary by subfield. In high-energy physics, collaborations list hundreds of authors alphabetically. Readers from different disciplines routinely misinterpret authorship signals from other fields Birnholtz (2006).
Third, the static nature of the author list conceals the temporal dynamics of contributions. Projects increasingly involve contributors who participate intensely during one phase but not others—a designer who creates the visual system, an engineer who builds critical components, a policy expert who provides essential guidance. These bounded but essential contributions are invisible in the byline.
Team Science and Rising Author Lists
The average number of authors per paper has grown steadily across virtually all scientific fields Wuchty et al. (2007). In biomedicine, papers with more than fifty authors are no longer unusual, and in fields like particle physics and climate science, author lists routinely exceed one thousand names. Even in traditionally small-team fields like psychology and economics, the median author count has roughly doubled in the past two decades.
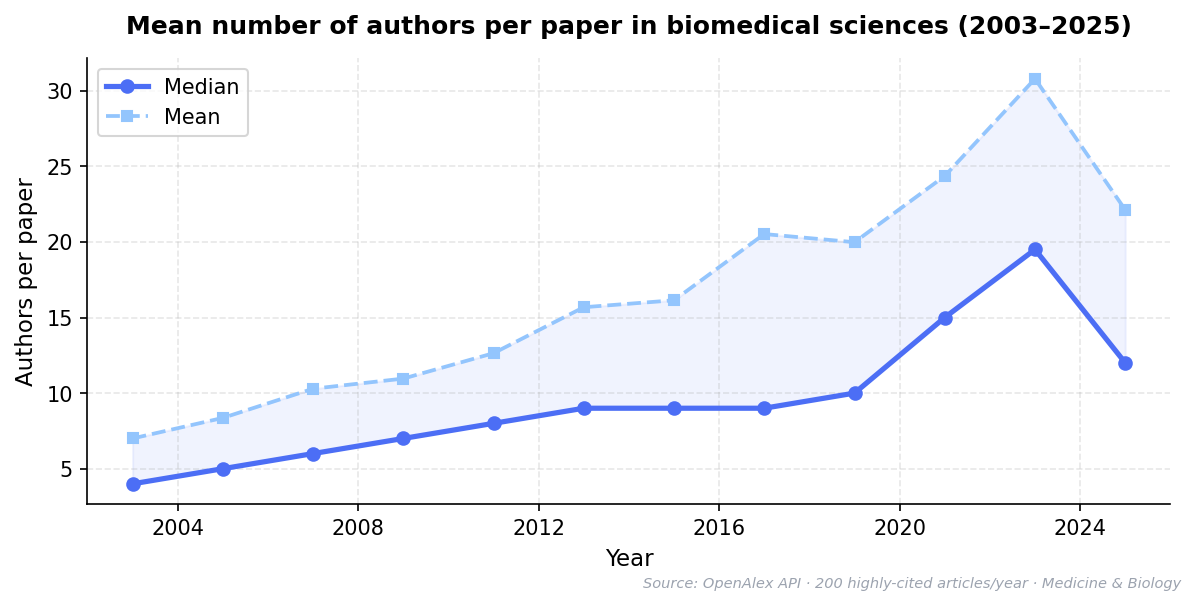
Figure 1:Mean number of authors per paper in biomedical sciences (2003–2025). Data from OpenAlex API, filtered to journal articles in Medicine and Biology. Sample of 200 highly-cited articles per year.
Figure generation code (gen_figure.py)
#!/usr/bin/env python3
"""Generate the author-count-growth figure as PNG."""
import matplotlib
matplotlib.use('Agg')
import matplotlib.pyplot as plt
import matplotlib.ticker as ticker
import yaml

with open('author-count-growth.yaml') as f:
    raw = yaml.safe_load(f)

data = raw['data']
years = [d['year'] for d in data]
means = [d['mean'] for d in data]
medians = [d['median'] for d in data]

fig, ax = plt.subplots(figsize=(8, 4))
ax.plot(years, medians, 'o-', color='#4c6ef5', linewidth=2.5, markersize=6, label='Median', zorder=3)
ax.plot(years, means, 's--', color='#93c5fd', linewidth=1.8, markersize=5, label='Mean', zorder=2)
ax.fill_between(years, medians, means, alpha=0.08, color='#4c6ef5')
ax.set_xlabel('Year', fontsize=11)
ax.set_ylabel('Authors per paper', fontsize=11)
ax.set_title('Mean number of authors per paper in biomedical sciences (2003\u20132025)',
             fontsize=12, fontweight='bold', pad=12)
ax.legend(frameon=True, fancybox=True, shadow=False, fontsize=10)
ax.grid(True, alpha=0.3, linestyle='--')
ax.set_xlim(2002, 2026)
ax.xaxis.set_major_locator(ticker.MultipleLocator(4))
ax.spines['top'].set_visible(False)
ax.spines['right'].set_visible(False)
fig.text(0.99, 0.01, 'Source: OpenAlex API \u00b7 200 highly-cited articles/year \u00b7 Medicine & Biology',
         ha='right', fontsize=7, color='#9ca3af', style='italic')
plt.tight_layout()
plt.savefig('author-count-growth.png', dpi=150, bbox_inches='tight')
print('Saved author-count-growth.png')
Source data (author-count-growth.yaml)
# ============================================================
# Mean number of authors per paper over time
# ============================================================
# AUTO-GENERATED by figures/fetch_author_count_growth.py
# Generated: 2026-03-15
# Source: OpenAlex API (https://openalex.org). Filtered to journal articles in Medicine and Biology concepts. Sample of 200 highly-cited articles per year.
# ============================================================

title: Mean authors per paper in biomedical sciences
xLabel: Year
yLabel: Mean authors per paper
source: OpenAlex API (https://openalex.org). Filtered to journal articles in Medicine
  and Biology concepts. Sample of 200 highly-cited articles per year.
generated: '2026-03-15'
data:
- year: 2003
  mean: 7.0
  median: 4.0
- year: 2005
  mean: 8.36
  median: 5.0
- year: 2007
  mean: 10.29
  median: 6.0
- year: 2009
  mean: 10.96
  median: 7.0
- year: 2011
  mean: 12.64
  median: 8.0
- year: 2013
  mean: 15.68
  median: 9.0
- year: 2015
  mean: 16.14
  median: 9.0
- year: 2017
  mean: 20.52
  median: 9.0
- year: 2019
  mean: 19.98
  median: 10.0
- year: 2021
  mean: 24.36
  median: 15.0
- year: 2023
  mean: 30.79
  median: 19.5
- year: 2025
  mean: 22.12
  median: 12.0
This growth reflects a genuine change in how research happens. Modern scientific problems—from understanding complex systems to building research infrastructure—require deep specialization in design, analysis, engineering, data management, and domain knowledge that no individual or small group possesses. The question is not whether to do team science but how to credit it fairly.
Current systems fail team science in specific, quantifiable ways: infrastructure contributors (software engineers, data curators, designers) are often listed in the “author positions of least credit” Larivière et al. (2016). Trainees who make crucial but bounded contributions face pressure to negotiate for first-author status Sauermann & Haeussler (2017). Senior collaborators who provide essential theoretical guidance cannot be differentiated from those added through gift authorship Wren et al. (2007). A richer attribution framework would reduce these tensions by making the nature and extent of each contribution transparent Rennie et al. (1997)Holcombe (2019).
Data Model
Our framework extends the CRediT vocabulary Brand et al. (2015) with three additional layers of contribution information. The first layer is section-level contributions: for each section of the manuscript, we record which authors contributed and in what capacity. This mapping reflects the reality of collaborative writing—different authors draft different sections, contribute domain-specific methodology, or provide revisions to particular portions of the text.
The second layer is figure-level contributions, documenting who generated data, created visualizations, or designed the presentation for each figure and table. Given that figures often represent the most labor-intensive elements of a paper—and the elements most often reused and cited—attributing them individually adds significant granularity to the contribution record.
The third layer is a project timeline: when each contributor joined the project, key milestones in their participation, and optionally when their active contribution ended. This temporal dimension makes visible the trajectory of a project and the different phases of contribution that characterize modern collaborative research.
Each author profile includes structured metadata aligned with ORCID standards Vasilevsky et al. (2021): institutional affiliations (linked to ROR IDs where available) and persistent identifiers. Critically, we focus on permanent, publication-relevant data—the facts about contributions that form part of the scholarly record.
Multi-Dimensional Ordering
The central design principle of our framework is that there is no single correct author ordering. Instead, the system supports dynamic re-sorting along multiple dimensions: alphabetical, number of CRediT roles, project join date, and—critically—by any specific CRediT role.
This last capability is particularly powerful. A reader interested in who led the conceptualization can sort by that role and immediately see the relevant contributors ranked by lead, equal, and supporting contribution levels. A hiring committee evaluating a candidate’s software contributions can sort by the Software role. A student looking for methodological expertise can sort by Methodology. Each sort dimension reveals a different facet of the contribution landscape.
By making re-sorting immediate and effortless, we shift the implicit message from “these authors are ranked” to “these authors contributed along multiple dimensions that you can explore.” The default alphabetical ordering reinforces this philosophy: when no ordering is privileged, readers naturally engage with the sort controls to explore the multi-dimensional contribution space.
Visualization Architecture
The framework presents authorship information through four complementary views, each optimized for different informational needs:
The Profiles view displays structured author metadata: affiliation, CRediT roles, and ORCID identifiers. This view serves as the primary “who are these researchers?” interface, offering far more context than a name in a byline.
The CRediT Matrix provides a grid visualization of all fourteen contributor roles across all authors, with contribution levels encoded through color intensity. This enables immediate visual comparison—revealing, for instance, that a paper’s fourth-listed author actually led three critical roles that no other author contributed to.
The Section Map shows which authors contributed to which manuscript sections, enabling readers to identify the relevant expert for any part of the paper. This is particularly valuable for readers seeking to contact the person who actually performed a specific analysis or wrote about a specific method.
The Timeline view displays each author’s engagement with the project over time, including milestones, making visible the temporal structure that the linear byline completely hides. A reader can see at a glance who was involved from the beginning, who joined for a specific phase, and how the team evolved over the project’s lifetime.
Implementation & Demonstration
Inline Contribution Highlighting
This article itself serves as a demonstration of inline contribution highlighting. Throughout the text, colored indicators in the margin identify which authors were primary contributors to each section. These annotations are derived from the same structured contribution data visible in the authorship panel above, creating a consistent and machine-readable record of who contributed to each part of the paper.
The color coding uses a consistent author-specific palette throughout all views, allowing readers to build familiarity with each contributor’s visual identity. The indicators show not just presence but degree—lead contributors are marked prominently, while supporting contributors appear with subtler indicators. This visual hierarchy communicates the same information as the CRediT level system but integrates it directly into the reading experience.
Hovering over any author indicator reveals their specific contribution description for that section. Clicking navigates to their full profile. This creates a layered information architecture: the casual reader sees colored dots indicating “multiple people contributed here”; the curious reader can hover for details; the thorough reader can click through to full contribution records.
Contribution Matrix
The CRediT contribution matrix (accessible via the “CRediT Matrix” tab in the authorship panel above) visually encodes the fourteen-role contribution landscape as a colored grid. Lead contributions appear with deep coloring, equal contributions with medium intensity, and supporting contributions with lighter coloring. Empty cells indicate no contribution to a given role.
This visualization makes immediately apparent what the linear byline obscures: the actual distribution of work across a research team. A “middle author” might lead three roles that no one else contributed to. The most prolific contributor in terms of CRediT roles might not be the first or last author. The visualization encourages readers to appreciate the full scope of contributions rather than relying on position-based assumptions.
Project Timeline
The timeline view reveals the temporal dynamics of collaboration that are invisible in traditional author lists. In the present paper, contributions spanned from January 2023 (project conception by the senior author) through early 2026 (final publication), with different team members joining at different phases and some completing their contributions well before the manuscript was finished.
This temporal view makes visible a reality that every researcher knows but that the byline hides: scientific projects are dynamic, with contributors entering and leaving at different stages. The designer who created the visual system may have completed her work a year before publication. The policy advisor who shaped the theoretical framework joined midway through. The engineer who built interactive components contributed during a bounded period. Each of these contributions was essential; none of them is captured by a static author list.
Discussion
The framework presented here addresses a structural problem in scholarly communication that has been recognized for decades. As early as 1997, Rennie, Yank, and Emanuel argued in JAMA that traditional authorship was failing and proposed replacing it with explicit contributorship Rennie et al. (1997). Their core insight—that a single byline cannot meaningfully represent the diverse roles within a research team—remains as urgent today as it was then, perhaps more so given the continued growth of team science documented by Wuchty, Jones, and Uzzi Wuchty et al. (2007).
Our framework builds directly on the CRediT (Contributor Roles Taxonomy) standard introduced by Brand et al. in 2015 Brand et al. (2015), which defined fourteen structured contributor roles that have since been adopted by over 5,000 journals. The call by Allen et al. in Nature to move “beyond authorship” toward transparent attribution Allen et al. (2014) and the cross-publisher consensus statement by McNutt et al. on CRediT adoption McNutt et al. (2018) established the institutional foundation on which our work rests. Holcombe went further, arguing that CRediT should replace—not merely supplement—traditional authorship entirely Holcombe (2019). We share this aspiration.
The empirical evidence for why such a shift is needed is compelling. Larivière et al. quantified how contributions actually distribute across research teams, revealing patterns far more complex than author position implies Larivière et al. (2016). Studies have estimated that over 20% of biomedical publications involve honorary or ghost authorship Wren et al. (2007), while Sauermann and Haeussler showed that authorship credit allocation actively shapes—and distorts—collaboration decisions Sauermann & Haeussler (2017). Birnholtz documented how different disciplines use author ordering as fundamentally different signals, creating systematic misinterpretation across fields Birnholtz (2006).
On the technical side, efforts by Vasilevsky et al. on the Contributor Role Ontology (CRO) have made CRediT machine-readable and linked to ORCID identifiers Vasilevsky et al. (2021), and the FORCE11 community has driven broader adoption of structured scholarly metadata FORCE11 (2016). Publishers including PLOS, eLife, and Cell Press have experimented with richer author metadata displays in their article pages.
What distinguishes the present work from these prior efforts is its focus on the reader-facing display and interaction layer. The existing literature overwhelmingly addresses how to collect structured contribution data; comparatively little work has addressed what the reader actually sees. In nearly all current implementations, CRediT data appears as a static table appended to the end of an article—an afterthought disconnected from the reading experience. The byline at the top remains unchanged: a linear list that implies a ranking. Our framework closes this gap by making contribution data the organizing principle of the authorship display itself—with dynamic re-sorting, inline section-level attribution, and the explicit design choice that no single author ordering is privileged.
Several implications deserve emphasis. First, this framework makes visible the contributions of individuals who are systematically under-credited in current systems: data curators, software engineers, visualization designers, research coordinators, and technical specialists. These roles are increasingly essential to modern science but remain largely invisible in traditional author lists Larivière et al. (2016). When a reader can sort by “Data Curation” or “Software” and see who led these contributions, the value of this work becomes self-evident.
Second, the framework reduces the stakes of author ordering by making position less consequential. When every contribution is transparently documented and can be viewed from multiple angles, the specific position in the byline matters less. This alone could significantly reduce authorship disputes—which remain among the most common and corrosive sources of friction in collaborative research Rennie et al. (1997)Wren et al. (2007).
Third, the machine-readable nature of the contribution data opens new possibilities for research evaluation Vasilevsky et al. (2021)FORCE11 (2016). Funding agencies, hiring committees, and promotion panels currently rely on crude proxies such as author position and journal prestige. Structured contribution data enables genuinely nuanced evaluation—crediting researchers for their specific role rather than assuming that “first author did most work” or “last author is the PI.”
Limitations of this framework include the documentation burden on authors, the need for journal and publisher adoption, and the challenge of verifying self-reported contributions. We believe these limitations are addressable: modern submission systems already collect CRediT data McNutt et al. (2018), section-level contributions map naturally to the collaborative writing process with tools like Google Docs and Overleaf that track per-author edits, and the transparency of public contribution records itself serves as a check on misrepresentation.
The future of scientific authorship must evolve to match the reality of scientific practice. Team science is here to stay—and growing Wuchty et al. (2007). The question is whether our attribution systems will continue to compress multi-dimensional contributions into a format designed for solo scholars, or whether we will build tools that celebrate the collaborative nature of discovery and give every contributor the credit they deserve. This demonstration is our contribution to that conversation.
- Rennie, D., Yank, V., & Emanuel, L. (1997). When authorship fails: a proposal to make contributors accountable. JAMA, 278(7), 579–585. 10.1001/jama.1997.03550070071041
- Wren, J. D., Kozak, K. Z., Johnson, K. R., Deakyne, S. J., Schilling, L. M., & Dellavalle, R. P. (2007). The write position: a survey of perceived contributions to papers based on byline position and number of authors. EMBO Reports, 8(11), 988–991. 10.1038/sj.embor.7401095
- Sauermann, H., & Haeussler, C. (2017). Authorship and contribution disclosures. Science Advances, 3(11), e1700404. 10.1126/sciadv.1700404
- Wuchty, S., Jones, B. F., & Uzzi, B. (2007). The increasing dominance of teams in production of knowledge. Science, 316(5827), 1036–1039. 10.1126/science.1136099
- Brand, A., Allen, L., Altman, M., Hlava, M., & Scott, J. (2015). Beyond authorship: attribution, contribution, collaboration, and credit. Learned Publishing, 28(2), 151–155. 10.1087/20150211
- McNutt, M. K., Bradford, M., Drazen, J. M., Hanson, B., Howard, B., Jamieson, K. H., Kiermer, V., Marcus, E., Pope, B. K., Schekman, R., Swaminathan, S., Stang, P. J., & Verma, I. M. (2018). Transparency in authors’ contributions and responsibilities to promote integrity in scientific publication. Proceedings of the National Academy of Sciences, 115(11), 2557–2560. 10.1073/pnas.1715374115
- Allen, L., Scott, J., Brand, A., Hlava, M., & Altman, M. (2014). Publishing: credit where credit is due. Nature, 508(7496), 312–313. 10.1038/508312a
- Birnholtz, J. P. (2006). What does it mean to be an author? The intersection of credit, contribution, and collaboration in science. Journal of the American Society for Information Science and Technology, 57(13), 1758–1770. 10.1002/asi.20380
- Larivière, V., Desrochers, N., Macaluso, B., Mongeon, P., Paul-Hus, A., & Sugimoto, C. R. (2016). Contributorship and division of labor in knowledge production. Social Studies of Science, 46(3), 417–435. 10.1177/0306312716650046
- Holcombe, A. O. (2019). Contributorship, not authorship: use CRediT to indicate who did what. Publications, 7(3), 48. 10.3390/publications7030048
- Vasilevsky, N. A., Hosseini, M., Teplitzky, S., Ilik, V., Mohammadi, E., Schneider, J., Kern, B., Colomb, J., Edmunds, S. C., Guber, K., Penfold, N. C., Huber, A., Steeves, V., Stall, S., Petrova, D., Collister, L. B., Grayson, S., Thomas, R. A., McGowan, R. J., … Holmes, K. L. (2021). Is authorship sufficient for today’s collaborative research? A call for contributor roles. Accountability in Research, 28(1), 23–43. 10.1080/08989621.2020.1779591
- FORCE11. (2016). The FAIR Guiding Principles for scientific data management and stewardship. Scientific Data, 3, 160018. 10.1038/sdata.2016.18