Abstract
The scientific author list has remained a linear, ordered sequence of names for over three centuries, despite radical changes in how research is conducted. This compression of multi-dimensional contributions into a one-dimensional ranking creates well-documented tensions: authorship disputes, invisibility of infrastructure contributors, and incentive structures that actively hinder collaborative team science. We present a multi-dimensional authorship framework that allows readers, institutions, and metrics systems to explore contributions along multiple axes simultaneously. Building on the CRediT (Contributor Roles Taxonomy) standard, our framework extends attribution with section-level contributions, project timelines, and rich author profiles. Critically, we reject the premise that any single author ordering is definitive. Instead, the reader can explore an interactive collaboration network that reveals shared-role connections between contributors, dynamically change visualizations or authorship order by CRediT roles and institution. Critically, the views can be centered around each individual. This paper simultaneously describes the framework and serves as a live demonstration: the interactive authorship display illustrates how rethinking author display can bring transparency, reduce conflict, and credit the diverse contributions that make modern science possible.
Introduction
The author byline has served as the primary unit of academic credit for over three centuries. Despite radical transformation in how science is conducted, from the solitary natural philosopher to hundred-person collaborations spanning continents, the format of authorship attribution has remained essentially unchanged: a linear, ordered list of names.
This flattening of rich, overlapping contributions into a single ordered sequence creates well-documented tensions. Early-career researchers depend on first-author publications for career advancement. Principal investigators expect last-author or corresponding-author designations to signal intellectual leadership. Middle authors, often building critical infrastructure, contributing specialized techniques, or performing essential validation, receive minimal credit differentiation.
The consequences are not merely symbolic. Authorship disputes are among the leading causes of research misconduct complaints Rennie et al. (1997). Junior researchers report delaying publications and avoiding collaborations to protect their authorship position Sauermann & Haeussler (2017). The incentive structures that flow from linear author lists actively hinder the collaborative, interdisciplinary team science that modern challenges demand Wuchty et al. (2007).
We propose a fundamentally different approach. Rather than flattening contributions into a single ranking, we offer an interactive explorer that surfaces far more of each person’s contribution than a linear list. The tool leverages the CRediT (Contributor Roles Taxonomy) standard and augments it with per-section attribution, project timelines, and detailed author profiles. Six complementary views let readers examine contributions from different angles: a force-directed collaboration network where spatial proximity reflects shared roles, clicking a node reveals that person’s ego-centric connections, and clicking a role or institution in the legend highlights the corresponding subgroup; a CRediT matrix showing contribution levels across all roles; section and timeline maps; a dynamically sortable author list that reinforces how no single ordering captures the full picture; and individual author profiles.
This paper doubles as a live demonstration: the interactive widget above shows how replacing the static byline with a navigable, multi-view display can foster transparency and properly acknowledge the breadth of contributions behind modern research.
Team science and rising author lists
The average number of authors per paper has grown steadily across virtually all scientific fields Wuchty et al. (2007). In biomedicine, papers with more than fifty authors are no longer unusual, and in fields like particle physics and climate science, author lists routinely exceed one thousand names. Even in traditionally small-team fields like psychology and economics, the median author count has roughly doubled in the past two decades.
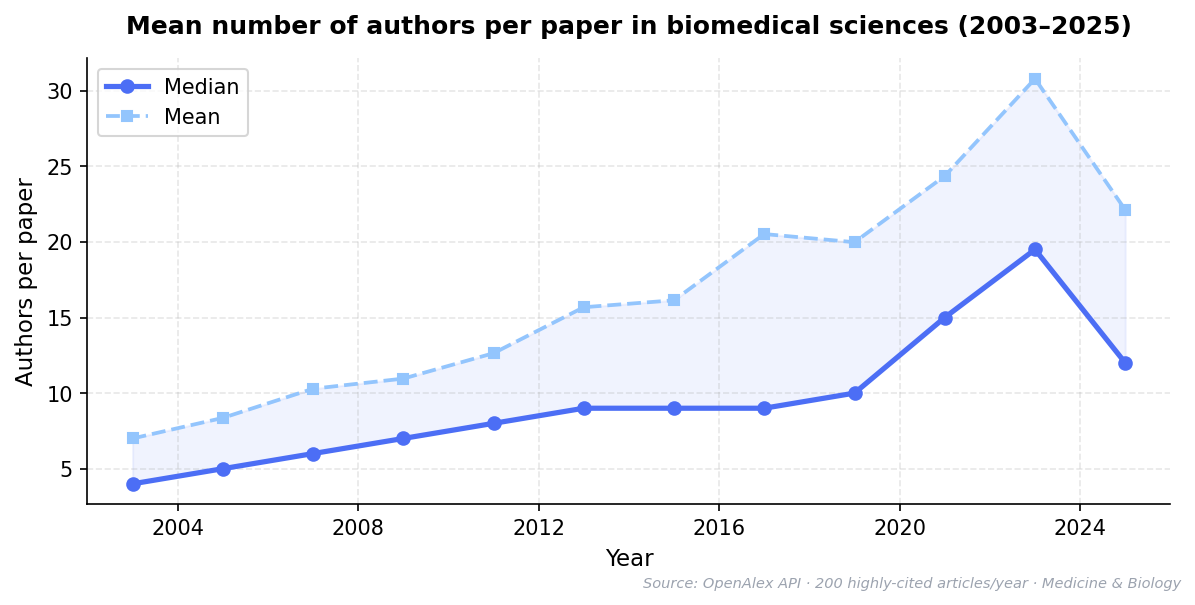
Figure 1:Mean number of authors per paper in biomedical sciences (2003–2025). Data from OpenAlex API, filtered to journal articles in Medicine and Biology. Sample of 200 highly-cited articles per year.
Figure generation code (gen_figure.py)
#!/usr/bin/env python3
"""Generate the author-count-growth figure as PNG."""
import matplotlib
matplotlib.use('Agg')
import matplotlib.pyplot as plt
import matplotlib.ticker as ticker
import yaml

with open('author-count-growth.yaml') as f:
    raw = yaml.safe_load(f)

data = raw['data']
years = [d['year'] for d in data]
means = [d['mean'] for d in data]
medians = [d['median'] for d in data]

fig, ax = plt.subplots(figsize=(8, 4))
ax.plot(years, medians, 'o-', color='#4c6ef5', linewidth=2.5, markersize=6, label='Median', zorder=3)
ax.plot(years, means, 's--', color='#93c5fd', linewidth=1.8, markersize=5, label='Mean', zorder=2)
ax.fill_between(years, medians, means, alpha=0.08, color='#4c6ef5')
ax.set_xlabel('Year', fontsize=11)
ax.set_ylabel('Authors per paper', fontsize=11)
ax.set_title('Mean number of authors per paper in biomedical sciences (2003\u20132025)',
             fontsize=12, fontweight='bold', pad=12)
ax.legend(frameon=True, fancybox=True, shadow=False, fontsize=10)
ax.grid(True, alpha=0.3, linestyle='--')
ax.set_xlim(2002, 2026)
ax.xaxis.set_major_locator(ticker.MultipleLocator(4))
ax.spines['top'].set_visible(False)
ax.spines['right'].set_visible(False)
fig.text(0.99, 0.01, 'Source: OpenAlex API \u00b7 200 highly-cited articles/year \u00b7 Medicine & Biology',
         ha='right', fontsize=7, color='#9ca3af', style='italic')
plt.tight_layout()
plt.savefig('author-count-growth.png', dpi=150, bbox_inches='tight')
print('Saved author-count-growth.png')
Source data (author-count-growth.yaml)
# ============================================================
# Mean number of authors per paper over time
# ============================================================
# AUTO-GENERATED by figures/fetch_author_count_growth.py
# Generated: 2026-03-15
# Source: OpenAlex API (https://openalex.org). Filtered to journal articles in Medicine and Biology concepts. Sample of 200 highly-cited articles per year.
# ============================================================

title: Mean authors per paper in biomedical sciences
xLabel: Year
yLabel: Mean authors per paper
source: OpenAlex API (https://openalex.org). Filtered to journal articles in Medicine
  and Biology concepts. Sample of 200 highly-cited articles per year.
generated: '2026-03-15'
data:
- year: 2003
  mean: 7.0
  median: 4.0
- year: 2005
  mean: 8.36
  median: 5.0
- year: 2007
  mean: 10.29
  median: 6.0
- year: 2009
  mean: 10.96
  median: 7.0
- year: 2011
  mean: 12.64
  median: 8.0
- year: 2013
  mean: 15.68
  median: 9.0
- year: 2015
  mean: 16.14
  median: 9.0
- year: 2017
  mean: 20.52
  median: 9.0
- year: 2019
  mean: 19.98
  median: 10.0
- year: 2021
  mean: 24.36
  median: 15.0
- year: 2023
  mean: 30.79
  median: 19.5
- year: 2025
  mean: 22.12
  median: 12.0
This growth reflects a genuine change in how research happens. Modern scientific problems, from understanding complex systems to building research infrastructure, require deep specialization in design, analysis, engineering, data management, and domain knowledge that no individual or small group possesses. The question is not whether to do team science but how to credit it fairly.
Current systems fail team science in specific, quantifiable ways. The byline persists as a numbered list that implies a ranking where none may exist: contributions in team science are often orthogonal, yet compressing them into positions 1 through N forces a false hierarchy. The convention of “first author did most work” and “last author is the PI” imposes a single interpretive frame on contributions that are fundamentally multi-dimensional. The static nature of the list further conceals temporal dynamics: projects increasingly involve contributors who participate intensely during one phase but not others, yet the byline flattens this into a single snapshot. Middle authors, who often include infrastructure contributors such as engineers and data curators, occupy positions associated with less credit than first or last authors Larivière et al. (2016). Trainees who make crucial but bounded contributions face pressure to negotiate for first-author status Sauermann & Haeussler (2017). The proliferation of workarounds (co-first authors, co-second authors, co-senior authors, equal-contribution footnotes) reveals how strained the linear model has become: teams are inventing ad hoc mechanisms to inject dimensionality into a format that was never designed for it Rennie et al. (1997)Holcombe (2019).
Some fields have responded by abandoning positional conventions altogether: in mathematics and economics, authors are traditionally listed alphabetically, and in high-energy physics, collaborations involving hundreds of researchers have stretched the byline model to the point where author position conveys little about individual contributions Birnholtz (2006). A more general solution, applicable across all disciplines, requires structured attribution that goes beyond linear ordering.
The CRediT taxonomy and its limits
The CRediT (Contributor Roles Taxonomy) standard was developed precisely to address these tensions. Published in 2015 by CASRAI Brand et al. (2015), it defines fourteen distinct contributor roles: Conceptualization, Methodology, Software, Validation, Formal analysis, Investigation, Resources, Data curation, Writing – original draft, Writing – review & editing, Visualization, Supervision, Project administration, and Funding acquisition. For each role, contributors can be assigned a degree of contribution: lead, equal, or supporting.
CRediT has gained nominal adoption. Many submission platforms now include CRediT fields McNutt et al. (2018), and publishers such as Elsevier encourage authors to provide a CRediT author statement. In practice, however, these statements typically appear as a brief, unstructured paragraph at the end of the paper. They list role names per author without indicating contribution levels, without machine-readable structure, and without any prominence in the article layout. Some publishers, including Springer Nature, do not use CRediT at all, relying instead on free-text author contribution statements Allen et al. (2014)Larivière et al. (2016).
CRediT thus does not resolve the structural problems of the byline. Even papers that include CRediT statements still present a numbered author list that readers and evaluation systems treat as a ranking. As currently deployed, CRediT is effectively binary: although the taxonomy defines three contribution levels (lead, equal, supporting), most publishers record only whether an author participated in a role, not at what level. The taxonomy provides no mechanism for section-level or figure-level attribution, no temporal information about when contributions occurred, and no machine-readable structure beyond a prose paragraph. It tells the reader that Author X did “Software” but not which software, in which phase of the project, or at what level relative to other contributors.
We propose to close this gap: an interactive, multi-dimensional authorship display that builds on CRediT’s vocabulary but extends it with contribution levels, section-level attribution, temporal information, and, critically, a reader-facing interface that replaces the static byline with an explorable view of the collaboration.
Interactive display
The framework presents authorship information through six complementary views, accessible via tabs in the interactive panel above. The Collaboration tab shows a force-directed network where spatial proximity directly reflects collaboration strength (shared CRediT roles); clicking any author reveals an ego-centric view of their connections, and clicking a role or institution in the legend highlights the relevant subgroup. The CRediT tab encodes the contribution landscape as a colored grid, with lead, equal, and supporting contributions distinguished by intensity. The Sections tab maps which authors contributed to each manuscript section and figure. The Timeline reveals when each contributor joined and what phases they participated in. The Sorted List allows dynamic re-sorting by alphabetical order, number of CRediT roles, any individual role, project join date, or institution. The Profiles view displays structured author metadata including affiliation, CRediT roles, ORCID identifiers, and profile photos when available.
A central design principle is that there is no single correct view of a collaboration. The Collaboration network makes this explicit for structure: clicking any author recenters the graph around that person’s connections, and clicking a role or institution in the legend reconfigures the view to highlight that subgroup. The Sorted List makes it explicit for ordering: a reader interested in who led the conceptualization can sort by that role; a hiring committee can sort by Software; a student can sort by Methodology. Every interaction reinforces the same message: contributions are multi-dimensional, and the reader chooses which dimension to foreground.
The interactive panel also supports an optional dataset switcher, allowing the reader to toggle between multiple author lists when configured. For this paper, we use it to demonstrate how the framework handles different team sizes: a small simulated team, a large simulated team of fifty authors, and the real contributor data.
Data model
CRediT was designed for standardization across papers: a fixed vocabulary that lets any reader compare contribution profiles between publications. What it does not provide is paper-specific transparency: the granular record of who did what, where, and when within a single project. Our data model extends the CRediT vocabulary Brand et al. (2015) with two optional levels of granularity. Both are designed to be filled incrementally: teams can start with CRediT roles alone and add detail as needed. The goal is not to impose documentation overhead but to provide the expressivity to alleviate common tensions in academic credit, making visible the contributions that the byline obscures.
The first extension is section- and figure-level contributions: for each section of the manuscript and each figure or table, we propose to record which authors contributed and in what capacity. This goes beyond documenting who wrote the text: it captures who performed the research, designed the methodology, built the tools, or generated the results that a given section reports. A section on data infrastructure, for instance, credits the engineers who built the pipeline, not merely the person who drafted the prose. Figures, often the most labor-intensive elements of a paper and the elements most often reused and cited, are attributed individually with the same granularity.
The second extension is a project timeline: when each contributor joined the project, key milestones in their participation, and optionally when their active contribution ended. This temporal dimension makes visible the trajectory of a project and the different phases of contribution that characterize modern collaborative research.
Concretely, the system reduces conflict through two mechanisms: first, by transparently documenting all contributions, making visible work that the byline obscures; and second, by diluting the zero-sum dynamic of linear ranking with 14 distinct CRediT roles, each offering a separate opportunity to lead.
The data model is designed to be extensible: because contribution data is stored in a simple YAML schema, teams can add custom fields or new attribution dimensions without modifying the display infrastructure. The core schema defines the current vocabulary, but future extensions (such as effort quantification, sub-role specializations, or domain-specific contribution types) can be layered on without breaking compatibility.
Each author profile includes structured metadata: institutional affiliations (linked to ROR IDs where available) and persistent identifiers such as ORCID. The core data model focuses on permanent, publication-relevant data: the facts about contributions that form part of the scholarly record. Separately, the display supports optional presentational metadata such as a profile photo (avatar_url). When a photo is provided, it replaces the default colored-initials avatar across all views, giving readers a more immediate, human connection to each contributor.
Methods
The framework is implemented as a MyST (Markedly Structured Text) plugin, leveraging the MyST ecosystem for scientific publishing. MyST extends Markdown with structured roles and directives designed for technical and scholarly content, supporting cross-references, citations, mathematical notation, and, critically for this work, executable and interactive components embedded directly in the document. However, the dependency on MyST is limited to build-time integration: the plugin that reads YAML files, validates the schema, and injects structured data into the document. The interactive widget itself is a self-contained ES module written in vanilla JavaScript and SVG with no framework dependencies. It receives a JSON payload of contribution data and renders the entire interface in the browser. Any publishing platform that can pass structured author data to a script tag can host the widget.
Contribution data is stored in YAML files that follow a schema extending the CRediT taxonomy. Each author entry includes standard metadata (name, affiliation, ORCID), CRediT roles with contribution levels (lead, equal, supporting), section-level contributions with free-text descriptions, figure-level attributions, and a timeline with join date and milestones. This structured format is both human-readable and machine-parseable, making it straightforward for authors to maintain and for downstream tools to consume.
The interactive display is implemented as a custom MyST directive ({authorship-explorer}) backed by an anywidget-compatible ESM module. At build time, the plugin reads the YAML author files, validates the schema, walks the document AST to extract section heading labels, and injects the structured data into the document as a widget node. At render time, the widget constructs the full interactive interface entirely in the browser using vanilla JavaScript and SVG, with no external dependencies beyond the MyST theme’s anywidget renderer.
The collaboration layout uses a force-directed simulation with repulsive forces between all nodes and attractive spring forces proportional to collaboration weight (shared CRediT roles weighted by contribution level), converging over 300 iterations with velocity damping and collision resolution to position authors so that spatial proximity directly reflects collaboration strength. Node radius reflects the breadth of each author’s contributions (number of roles plus section involvement). Connections between authors are drawn as per-role minimum spanning trees: for each CRediT role, a minimum spanning tree connects all authors who share that role, with edge weights derived from spatial distance. This reduces visual clutter from O(n²) all-pairs edges to O(n) edges per role while preserving the network’s topology. On hover, the full MST trees for the hovered author’s roles are highlighted, with individual role strands rendered as parallel colored lines whose thickness encodes contribution level.
The implementation renders inside a Shadow DOM to isolate widget styles from the host document, ensuring consistent appearance across different MyST themes. The widget also injects minimal styles into the host document to relocate itself into the article’s frontmatter region and hide the default linear author list, replacing it with the interactive display.
The plugin and widget code were developed with the assistance of Claude Opus 4.6 (Anthropic), used as a coding agent within VS Code. The LLM generated the initial implementation of the MyST plugin, the anywidget ESM module, and the SVG-based visualizations, with the author providing architectural direction, iterative feedback, and manual refinements. This paper was also drafted collaboratively with the same model.
Discussion
The framework presented here addresses a structural problem in scholarly communication that has been recognized for decades. As early as 1997, the proposal to replace traditional authorship with explicit contributorship appeared in JAMA Rennie et al. (1997). The core insight (that a single byline cannot meaningfully represent the diverse roles within a research team) remains as urgent today as it was then, perhaps more so given the continued growth of team science Wuchty et al. (2007).
Prior work has called to move “beyond authorship” toward transparent attribution Allen et al. (2014), built cross-publisher consensus on CRediT adoption McNutt et al. (2018), and argued that CRediT should replace traditional authorship entirely Holcombe (2019).
On the technical side, several tools and standards have advanced structured contributorship, but each addresses only part of the problem.
PLOS was an early adopter of CRediT and now displays per-author roles on a dedicated Authors tab for each article. Each author entry lists CRediT role names (e.g. “Conceptualization, Data curation, Formal analysis”), an institutional affiliation, and an ORCID link. However, the display is static text, roles are binary (present or absent, with no lead/equal/supporting distinction), and there is no visualization, no interactivity, and no section-level attribution. The contribution information lives on a secondary tab rather than in the article’s main view. eLife similarly lists CRediT roles and ORCID links beneath each author name at the bottom of the article. Both publishers surface structured contribution data, but the display remains static text with binary roles, no visualization, and no way for the reader to re-sort or explore contributions dynamically.
Tenzing Holcombe et al. (2020) is a web application and R package that lets teams document CRediT contributions via a shared spreadsheet and generate outputs such as prose contribution statements, JATS XML metadata, and structured affiliation blocks. It is an input tool, not a display tool: its outputs are static text or metadata files, not interactive reader-facing components.
The Contributor Role Ontology (CRO) Vasilevsky et al. (2021) extends CRediT into a formal OWL ontology with finer-grained roles, making contribution data machine-readable and linkable to ORCID identifiers. The FORCE11 community has advocated for structured scholarly metadata more broadly Wilkinson et al. (2016). These efforts provide essential infrastructure for computational attribution, but they define schemas and vocabularies, not reader-facing tools. No existing ontology or metadata standard produces a display that a reader can explore.
Yet none of these efforts have changed what the reader actually sees. Our framework addresses this gap: six interactive views that let readers explore contributions from multiple angles, shifting the message from “these authors are ranked” to “these authors contributed along dimensions you can explore.”
This shift has concrete consequences for how credit is assigned, how disputes arise, and how evaluation systems operate.
The linear byline creates systematic credit bias against contributors whose roles do not map onto first- or last-author conventions. Data curators, engineers, research coordinators, and technical specialists are increasingly essential to modern science yet remain invisible in traditional author lists Larivière et al. (2016). Students and postdocs fare little better: their contributions are routinely compressed into an ambiguous middle-author position that tells a hiring committee almost nothing. By shifting the culture toward authorship transparency (letting a reader sort by “Data Curation” or “Software” and see who led these contributions) credit is distributed more fairly and truthfully. More broadly, the dialogue about credit bias, who is made visible and who is not, should take the front stage in how the scientific community thinks about authorship.
An interactive display backed by structured contribution data reduces the stakes of author ordering by making position less consequential. When every contribution is transparently documented and can be viewed from multiple angles, the specific position in the byline matters less. This alone could significantly reduce authorship disputes, which remain among the most common sources of friction in collaborative research Rennie et al. (1997).
Rather than pressuring teams to restrict author lists, this approach allows them to grow. When the only way to credit someone is a position in a linear ranking, every addition dilutes the signal for everyone else, creating an incentive to exclude contributors whose roles are harder to categorize. With structured contribution data, adding an author costs nothing: their specific roles are documented, and no one else’s credit is diminished. This removes an artificial gatekeeping mechanism and encourages teams to include everyone who contributed.
This inclusive stance represents a deliberate departure from the ICMJE (International Committee of Medical Journal Editors) authorship criteria International Committee of Medical Journal Editors (2025), which require that all authors meet four conditions: (1) substantial contributions to conception, design, or data acquisition/analysis; (2) drafting the work or revising it critically; (3) final approval of the published version; and (4) agreement to be accountable for all aspects of the work. Contributors who do not meet all four criteria are relegated to an acknowledgments section. We argue that this two-tier system is a product of the linear byline’s limitations, not a principled distinction. When the only way to credit someone is a position in a ranked list, gatekeeping criteria are needed to prevent that list from becoming meaninglessly long. But with structured contribution data, each person’s specific roles are transparently documented, and no such gatekeeping is necessary. A data engineer who built a critical pipeline, a research coordinator who managed a multi-site study, or a statistician who contributed a single validated analysis method all deserve to be credited for exactly what they did, without being required to also draft and approve the manuscript. The ICMJE’s accountability criterion (that every author must be responsible for “all aspects of the work”) is fundamentally at odds with how team science now functions: in a hundred-person collaboration, no individual can meaningfully vouch for every aspect. Our framework resolves this by documenting precisely which parts of the work each contributor is responsible for, making accountability specific rather than universal. With this level of transparency, the fraud-prevention rationale behind restrictive authorship criteria is better served by clear documentation than by exclusion.
The machine-readable nature of the contribution data opens new possibilities for research evaluation Vasilevsky et al. (2021)Wilkinson et al. (2016). Funding agencies, hiring committees, and promotion panels currently rely on crude proxies such as author position and journal prestige. Structured contribution data enables genuinely nuanced evaluation, crediting researchers for the specific roles they performed.
Structured contribution data could evolve into a new de facto standard for scholarly attribution. Today the ordered author list is that standard, not because it is adequate but because nothing better has displaced it. The YAML format used in this framework offers a concrete alternative: a simple, human-readable, machine-parseable file that any researcher can create, any version-control system can track, and any tool can consume. If journals, preprint servers, and funding agencies converged on a common contribution schema, even a minimal one recording CRediT roles and contribution levels, an author’s ORCID profile could aggregate structured contribution records across all their publications, producing a contribution portfolio rather than a publication list. Hiring committees would no longer see a CV listing “Author 4 of 12” on a Nature paper; they would see that the candidate led Software and Data Curation across a body of work and contributed equally to Formal Analysis in two others.
The interactive display operates within the scope of a single paper and replaces the traditional byline with a richer, multi-dimensional view. It is fully compatible with existing citation infrastructure: DOI metadata, BibTeX records, and in-text citations such as “Smith et al. (2025)” continue to work unchanged. We view the interactive display as a necessary step toward shifting the culture of credit attribution: once contribution data is routinely recorded and visible, the community can build on it. Future work on citation conventions could further reduce name-based credit biases, for instance by citing large collaborations under a project name or by replacing “first-author et al.” with human-readable short titles linked to DOIs.
Limitations of this framework include the documentation burden on authors, the need for journal and publisher adoption, and the challenge of verifying self-reported contributions. We believe these limitations are addressable: modern submission systems already collect CRediT data McNutt et al. (2018), section-level contributions map naturally to how teams already divide work, with each contributor knowing which parts of the project they led or supported, and the transparency of public contribution records itself serves as a check on misrepresentation. The contribution data itself is stored in simple YAML files that any researcher can edit in a text editor, version-control with Git, and validate without specialized tools. This low barrier to entry means adoption does not depend on any particular publishing platform.
The documentation effort is modest compared to the time researchers already spend negotiating authorship order. In our experience, these conversations can consume hours of discussion, generate lasting resentment, and occasionally derail collaborations entirely. Filling out a structured contribution record takes minutes. More importantly, the process itself can diffuse tensions: when contributors see their specific roles documented transparently, the pressure to fight for a particular byline position diminishes. The documentation is not an added cost but a replacement for a far more expensive and time-consuming process.
Adoption does not require journals to migrate to MyST or any particular publishing platform. The interactive display demonstrated here is implemented entirely in standard JavaScript and SVG, with no framework dependencies. Any journal website that can embed a script tag can host an interactive contribution viewer alongside the traditional article layout. Journals already routinely embed interactive figures, supplementary viewers, and altmetric widgets. An authorship explorer is no different in kind. Rather than treating authorship disputes as an inevitable cost of publication, journals could provide structured contribution tools as part of the submission process, helping authors document and resolve attribution questions before they become conflicts. The workflow is straightforward: each author fills in their own contributions in parallel, the tool aggregates the entries and flags discrepancies, and the team reviews and approves the final record together. This is a solvable engineering problem, not a conceptual one.
Not all contexts support interactivity. Printed papers, PDFs, and citation managers will continue to require a static representation. In these settings, we propose replacing the traditional ordered byline with a textual contribution summary, a string describing who did what, generated directly from the structured data. A static rendering of the collaboration network can also serve as a figure or as a poster header, conveying at a glance the structure of a team’s contributions. Where a name list is unavoidable, we recommend alphabetical ordering, a convention already standard in mathematics, economics, and high-energy physics, so that the recorded order carries no credit bias.
The future of scientific authorship must evolve to match the reality of scientific practice. Team science is here to stay and growing Wuchty et al. (2007). We call on the community to replace attribution systems that compress multi-dimensional contributions into a format designed for solo scholars with tools that celebrate the collaborative nature of discovery and give every contributor the credit they deserve.
- Rennie, D., Yank, V., & Emanuel, L. (1997). When authorship fails: a proposal to make contributors accountable. JAMA, 278(7), 579–585. 10.1001/jama.1997.03550070071041
- Sauermann, H., & Haeussler, C. (2017). Authorship and contribution disclosures. Science Advances, 3(11), e1700404. 10.1126/sciadv.1700404
- Wuchty, S., Jones, B. F., & Uzzi, B. (2007). The increasing dominance of teams in production of knowledge. Science, 316(5827), 1036–1039. 10.1126/science.1136099
- Larivière, V., Desrochers, N., Macaluso, B., Mongeon, P., Paul-Hus, A., & Sugimoto, C. R. (2016). Contributorship and division of labor in knowledge production. Social Studies of Science, 46(3), 417–435. 10.1177/0306312716650046
- Holcombe, A. O. (2019). Contributorship, not authorship: use CRediT to indicate who did what. Publications, 7(3), 48. 10.3390/publications7030048
- Birnholtz, J. P. (2006). What does it mean to be an author? The intersection of credit, contribution, and collaboration in science. Journal of the American Society for Information Science and Technology, 57(13), 1758–1770. 10.1002/asi.20380
- Brand, A., Allen, L., Altman, M., Hlava, M., & Scott, J. (2015). Beyond authorship: attribution, contribution, collaboration, and credit. Learned Publishing, 28(2), 151–155. 10.1087/20150211
- McNutt, M. K., Bradford, M., Drazen, J. M., Hanson, B., Howard, B., Jamieson, K. H., Kiermer, V., Marcus, E., Pope, B. K., Schekman, R., Swaminathan, S., Stang, P. J., & Verma, I. M. (2018). Transparency in authors’ contributions and responsibilities to promote integrity in scientific publication. Proceedings of the National Academy of Sciences, 115(11), 2557–2560. 10.1073/pnas.1715374115
- Allen, L., Scott, J., Brand, A., Hlava, M., & Altman, M. (2014). Publishing: credit where credit is due. Nature, 508(7496), 312–313. 10.1038/508312a
- Holcombe, A. O., Kovacs, M., Aust, F., & Aczel, B. (2020). Documenting contributions to scholarly articles using CRediT and tenzing. PLOS ONE, 15(12), e0244611. 10.1371/journal.pone.0244611
- Vasilevsky, N. A., Hosseini, M., Teplitzky, S., Ilik, V., Mohammadi, E., Schneider, J., Kern, B., Colomb, J., Edmunds, S. C., Guber, K., Penfold, N. C., Huber, A., Steeves, V., Stall, S., Petrova, D., Collister, L. B., Grayson, S., Thomas, R. A., McGowan, R. J., … Holmes, K. L. (2021). Is authorship sufficient for today’s collaborative research? A call for contributor roles. Accountability in Research, 28(1), 23–43. 10.1080/08989621.2020.1779591
- Wilkinson, M. D., Dumontier, M., Aalbersberg, Ij. J., Appleton, G., Axton, M., Baak, A., Blomberg, N., Boiten, J.-W., da Silva Santos, L. B., Bourne, P. E., Bouwman, J., Brookes, A. J., Clark, T., Crosas, M., Dillo, I., Dumon, O., Edmunds, S., Evelo, C. T., Finkers, R., … Mons, B. (2016). The FAIR Guiding Principles for scientific data management and stewardship. Scientific Data, 3, 160018. 10.1038/sdata.2016.18
- International Committee of Medical Journal Editors. (2025). Recommendations for the Conduct, Reporting, Editing, and Publication of Scholarly Work in Medical Journals: Defining the Role of Authors and Contributors. https://www.icmje.org/recommendations/browse/roles-and-responsibilities/defining-the-role-of-authors-and-contributors.html