The introduction defined VIP-expressing interneurons through their disinhibitory role and motivated a critical reassessment of that framing. Before any reassessment is possible, we must specify what cells the label “VIP” actually refers to in contemporary cortical neuroscience. This section catalogues the molecular ground truth: the transcriptomic, marker-gene, and developmental-class evidence that anchors the VIP subclass within cortical inhibition. The section’s central thesis is that VIP interneurons are a CGE-derived, 5-HT3AR+ GABAergic subclass whose subclass-level identity is now unambiguous across modern single-cell atlases, but whose internal granularity — how many transcriptomic types (t-types), how discrete the boundaries between them, and how those types map onto immunolabel- and Cre-driver-based definitions — remains a moving target that depends on dataset, species, taxonomic resolution, and integration method. Reconciling the disinhibitor framing with the multimodal evidence reviewed in subsequent sections requires holding this molecular indeterminacy in mind: many cross-study disagreements about VIP function trace upstream to whether different laboratories are sampling the same cells.
The 5-HT3AR/CGE class places VIP in cortical inhibition
The modern partition of cortical GABAergic interneurons rests on a tripartite scheme in which essentially every neocortical inhibitory neuron expresses one of three principal markers — parvalbumin (PV), somatostatin (SST), or the ionotropic serotonin receptor 5-HT3AR — accounting between them for nearly the entire interneuron population Rudy et al., 2010Tremblay et al., 2016. Rudy et al. (2010) consolidated immunohistochemical, electrophysiological, and developmental evidence to argue that PV+ neurons constitute roughly forty percent of neocortical GABAergic cells, SST+ neurons roughly thirty percent, and 5-HT3AR-expressing neurons the remaining thirty percent — the three groups together accounting for nearly the entire inhibitory population. The 5-HT3AR class subsumes the entirety of the VIP+ population, and Tremblay et al. (2016) clarified that VIP+ neurons make up approximately forty percent of the 5-HT3AR group, with the non-VIP 5-HT3AR remainder corresponding to layer-1-enriched neurogliaform cells that are now identified as the Lamp5 subclass. Genetic evidence from a BAC-transgenic 5-HT3AR-GFP line confirmed the marker logic at the population level: 5-HT3AR is expressed in essentially all neocortical interneurons that lack PV or SST, and fate mapping in the same line showed that the 5-HT3AR+ compartment encompasses the full repertoire of caudal-ganglionic-eminence (CGE)-derived interneurons Lee et al., 2010. Together with the GAD67-GFP knock-in framework of Tamamaki et al. (2003), which placed CR-, PV-, and SST-immunoreactive subsets within a known total GABAergic abundance of approximately twenty percent of cortical NeuN+ neurons, these studies established the quantitative envelope that subsequent transcriptomic atlases would refine but not overturn.
The CGE-derived 5-HT3AR class is internally heterogeneous. Triple immunostaining of mouse visual cortex resolved at least thirteen combinatorial groups of cortical GABAergic neurons defined by overlapping expression of PV, CR, SST, CCK, NPY, VIP, and ChAT Gonchar, 2008, and double-label quantification across cortex confirmed that PV, SST, and VIP define three reliably non-overlapping subpopulations while CR and NPY overlap substantially with SST Xu et al., 2009. In barrel cortex, VIP-expressing interneurons amount to about thirteen percent of all GABAergic neurons, with the majority residing in supragranular layers and showing layer-dependent differences in morphology and intrinsic properties Prönneke et al., 2015. These pre-transcriptomic enumerations matter because they define the empirical denominator against which scRNA-seq taxonomies must be checked: the VIP subclass is, on every counting method, a numerically minor but layer-biased subset of cortical inhibition.
scRNA-seq atlases established the modern subclass framework
Single-cell transcriptomics consolidated the VIP/SST/PV/Lamp5 subclass partition into a hierarchical scheme that is now the field’s reference frame. Tasic et al. (2016) profiled 1,679 high-quality single cells from adult mouse primary visual cortex with SMART-seq and recovered forty-nine transcriptomic types — twenty-three GABAergic, nineteen glutamatergic, and seven non-neuronal — with the GABAergic types organised around the Vip, Sst, and Pvalb subclasses. The same V1 study identified discrete Vip t-types including Vip-Chat, Vip-Gpc3, Vip-Mybpc1, Vip-Sncg, and Vip-Parm1, treating each as a transcriptomically separable cluster rather than a combinatorial gradient Tasic et al., 2016. Two years later, Tasic et al. (2018) extended the approach to 23,822 cells across both VISp and the anterior lateral motor area (ALM) and proposed six GABAergic subclasses — Sst, Pvalb, Vip, Lamp5, Sncg, and Serpinf1 — with the major split reflecting medial-versus-caudal ganglionic-eminence developmental origin. In this expanded taxonomy the Vip subclass alone resolved into roughly fourteen t-types, with Lamp5, Vip, Sncg, and Serpinf1 together forming the CGE-derived neighbourhood of the constellation diagram Tasic et al., 2018. The convergence on the same six-subclass partition by orthogonal large-scale efforts — the BICCN consensus of seven scRNA-seq and snRNA-seq mouse motor cortex datasets Yao et al., 2021, the comprehensive isocortex-plus-hippocampus atlas of Yao et al. (2021), and the whole-brain atlas of Yao et al. (2023) — established that the subclass level is method- and dataset-independent. Independently, Zeisel et al. (2015) had already shown that scRNA-seq of mouse somatosensory cortex and CA1 recovered forty-seven molecularly distinct subclasses spanning the major cortical types, and Zeisel et al. (2018) extended this to the entire mouse nervous system, organising cell-type structure around three overlapping principles — major class, developmental origin, and neurotransmitter type — within which cortical Vip/Sst/Pvalb form a major axis.
The robustness of the subclass framework is not just an aesthetic claim about clustering. Crow et al. (2018) formalised the question with the MetaNeighbor framework and showed that the major cortical interneuron classes (Vip, Sst, Pvalb) replicate at high quantitative reliability across independent scRNA-seq datasets, whereas fine-grained subdivisions replicate progressively less well as taxonomic resolution increases. Multimodal datasets reach the same conclusion from a different direction: in the Patch-seq atlas of Gouwens et al. (2020), integrated transcriptomic, electrophysiological, and morphological data resolved 28 congruent met-types whose top-level structure recovers the Lamp5, Vip, Sst, and Pvalb subclass partition, indicating that intrinsic and morphological features carry subclass information broadly consistent with the transcriptomic taxonomy. Generative biophysical modelling of Patch-seq cells likewise showed that ion-channel conductance vectors cluster by transcriptomic subclass and that channel composition itself encodes interneuron identity at the subclass level Nandi et al., 2022. Even the protein-level signalling layer carries the same partition: every cortical neuron type, including each VIP supertype, expresses a stereotyped combination of neuropeptide and neuropeptide-receptor genes, embedding the subclass scheme into a dense paracrine network Smith et al., 2019. The methodological enabler underlying this convergence is Patch-seq, introduced independently by Cadwell et al. (2015) and Fuzik et al. (2015), which combined whole-cell electrophysiology, full-transcriptome scRNA-seq, and morphological reconstruction in single neurons and made it possible to ask whether transcriptomic types map onto the morpho-electric phenotypes that defined cortical interneurons before transcriptomics existed.
Within-VIP heterogeneity: counting types is resolution-dependent
The number of “VIP types” reported by an atlas is a function of clustering depth, not a measurement of biological discreteness. The clearest demonstration of this is the contrast between two studies from the same Allen Institute laboratory: Tasic et al. (2016) resolved approximately five Vip t-types in mouse V1, while Tasic et al. (2018) identified roughly fourteen Vip t-types across VISp and ALM. The expansion was not a contradiction but a deeper cut: a more than ten-fold increase in cell number, two cortical areas instead of one, and a deeper hierarchical clustering yielded finer-grained partitions of what is plausibly the same underlying cell-type space. Subsequent atlases extended this trend without converging on a fixed count: the BICCN MOp consensus reported replicable Vip subclasses across datasets and methods but did not reduce to a single agreed type list Yao et al., 2021; the isocortex-plus-hippocampus atlas of Yao et al. (2021) partitioned Vip into six supertypes within the CGE neighbourhood, with additional supertypes restricted to hippocampal formation; and the whole-brain mouse atlas reported 1,201 supertypes and 5,322 clusters across thirty-four classes, providing a still-finer reservoir from which area-specific Vip type lists can be drawn Yao et al., 2023. Across these atlases the Vip subclass and its supertype tier are stable; the cluster tier is not.
The same instability appears when transcriptomic taxonomies are compared against the marker-protein subdivisions that pre-existed scRNA-seq. Tremblay et al. (2016) reviewed the immunohistochemical and slice-electrophysiology literature and proposed three principal VIP subdivisions defined by secondary marker expression: VIP/CCK multipolar basket cells, VIP/CR irregular-spiking bipolar cells, and a small VIP/ChAT bipolar subtype. Mayer et al. (2018), profiling early postmitotic CGE and MGE interneuron precursors by scRNA-seq, identified the cardinal mature interneuron lineages — including a Vip lineage — already pre-specified before terminal differentiation. Either framework — three marker classes or roughly fourteen t-types — can be defended as a “true” partition; they differ because they apply different similarity thresholds at different developmental times to populations measured with different feature spaces. The granularity question is therefore methodological rather than empirical: at the marker-protein resolution of Tremblay et al. (2016) and Paul et al. (2017), who described an interneuron-selective disinhibitory VIP/CR subpopulation and a CCK-basket subpopulation as the dominant axes of VIP class structure, three subdivisions suffice; at the cluster resolution of Tasic et al. (2018) or Yao et al. (2021), more do.
The combinatorial slice-electrophysiology and IHC studies that preceded scRNA-seq already foreshadowed this resolution-dependence. Kawaguchi & Kubota (1996) and Kawaguchi (1997) distinguished PV+ fast-spiking, late-spiking neurogliaform, and a heterogeneous regular- and burst-spiking group containing SST/Martinotti and VIP/double-bouquet cells in rat frontal cortex. Kawaguchi (1997) further showed that cholinergic agonists selectively depolarise VIP- and SST-immunoreactive interneurons but not PV fast-spiking or late-spiking cells, a neurochemical fingerprint that survives in modern transcriptomic profiles of VIP receptor expression. Toledo-Rodriguez et al. (2005) applied multiplex single-cell RT-PCR for CB, PV, CR, NPY, VIP, SST, and CCK to 268 morphologically identified rat S1 interneurons and recovered seven distinct expression-based clusters that preferentially contained one anatomical class — an early demonstration that combinatorial neuropeptide/calcium-binding-protein codes carry cell-type information that aligns broadly, but not perfectly, with morphology. Wang et al. (2004) characterised Martinotti cells in juvenile rat S1 and showed that layer-specific axonal targeting and accommodating firing pattern are anchored within the SST class, providing a methodological template subsequently applied to VIP. Read with hindsight, these pre-genomic studies recovered roughly the marker-protein resolution that Tremblay et al. (2016) formalised as three principal VIP subtypes; the scRNA-seq atlases that followed nest those marker subdivisions inside finer-grained cluster tiers without invalidating them.
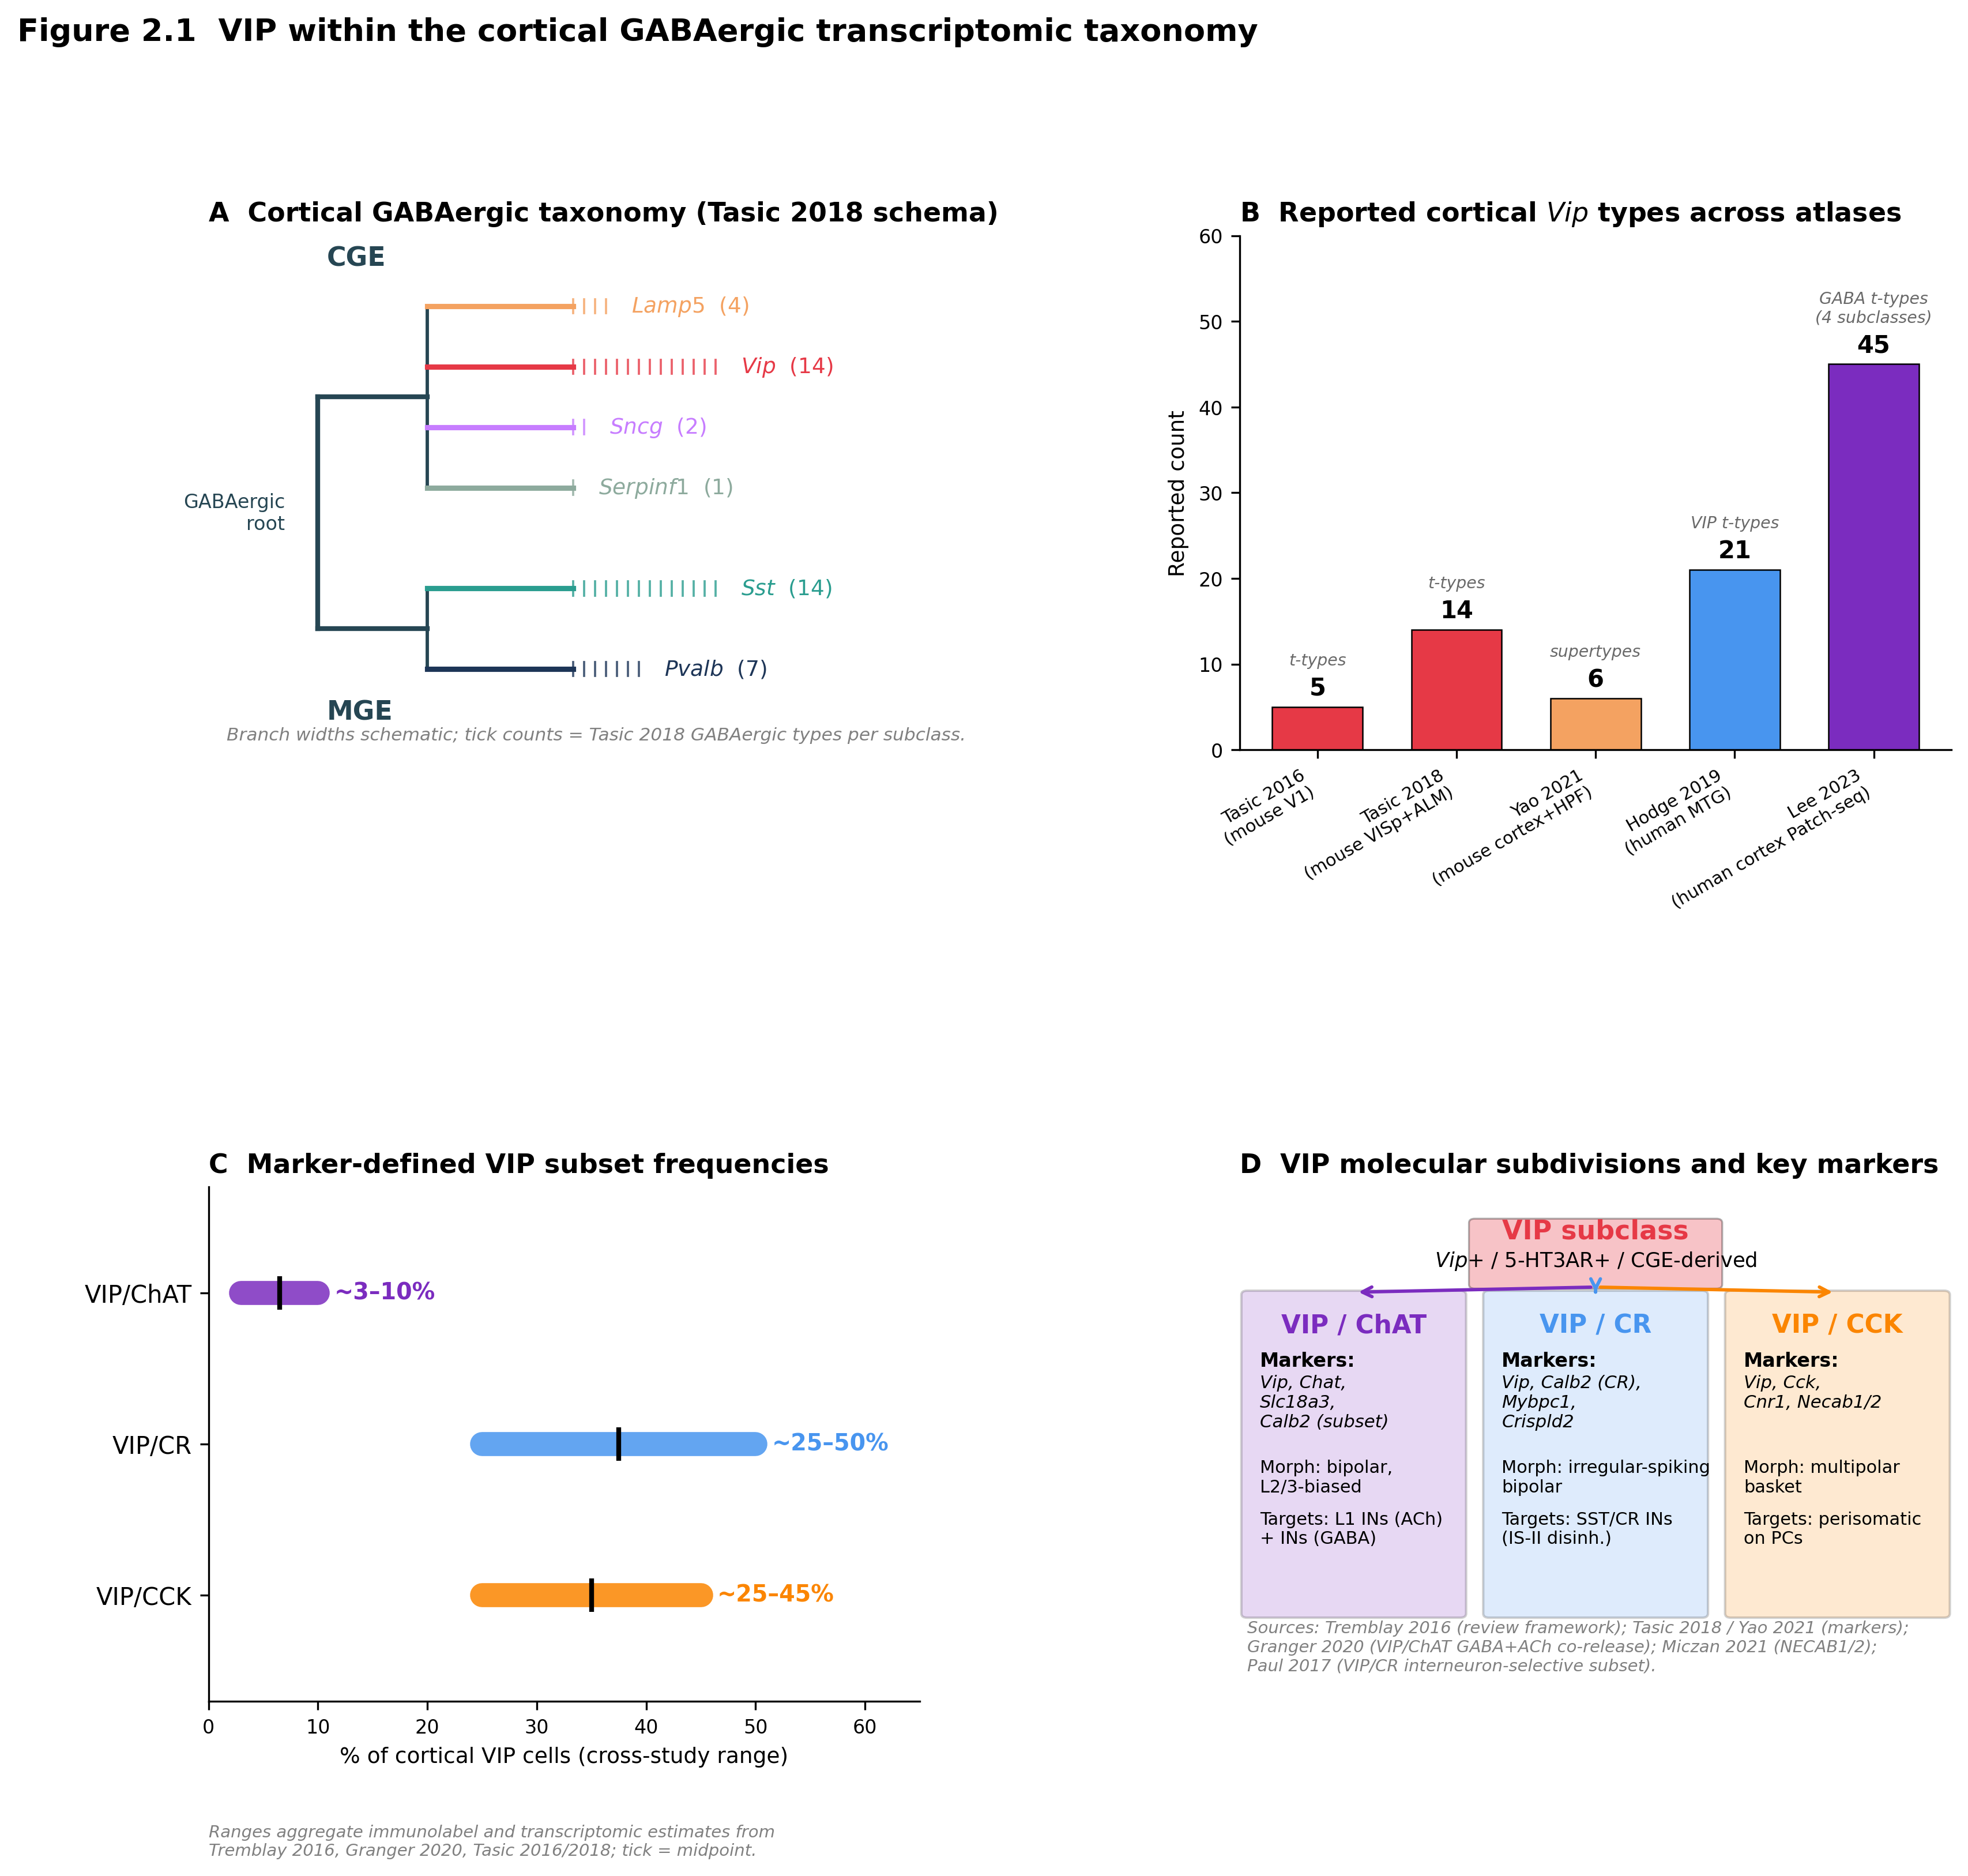
Figure 1:VIP within the cortical GABAergic transcriptomic taxonomy. (A) Hierarchical schematic of the established six-subclass scheme of Tasic et al., 2018, separating the CGE branch (Lamp5, Vip, Sncg, Serpinf1) from the MGE branch (Sst, Pvalb); branch widths reflect the qualitative ordering of GABAergic types per subclass and are not drawn to a quantitative scale. (B) Reported counts of cortical Vip transcriptomic types (or supertypes/consensus types) across five reference atlases: Tasic et al., 2016 (mouse V1, ~5 Vip t-types), Tasic et al., 2018 (mouse VISp+ALM, ~14 Vip t-types), Yao et al., 2021 (mouse isocortex+HPF, 6 Vip supertypes), Hodge et al., 2019 (human MTG, 21 VIP t-types), and Lee et al., 2023 (human cortex Patch-seq, VIP within 45 GABAergic types across four subclasses). The values are not on a common denominator and must not be interpreted as a single quantitative scale: Tasic 2018’s GABAergic type count covers VISp+ALM (60 types in VISp; ~50% shared across areas), Hodge 2019 is single-nucleus RNA-seq from human MTG (75 t-types include both excitatory and inhibitory), and the Yao 2021 supertype tier is a level coarser than Tasic 2018 t-types — supertypes are subdivisions WITHIN the three CGE subclasses, not independent categories. (C) Subset frequencies for VIP/ChAT and VIP/CR cells reported as approximate ranges across studies; values aggregate immunolabel and transcriptomic estimates and span ~5–25% of cortical VIP cells, with VIP/ChAT consistently the rarer subset Tremblay et al., 2016Granger et al., 2020Tasic et al., 2016Tasic et al., 2018. (D) Schematic of the three principal VIP molecular subdivisions reviewed by Tremblay et al., 2016: VIP/ChAT cholinergic bipolar cells, VIP/CR interneuron-selective bipolar cells, and VIP/CCK multipolar basket cells, with annotated marker genes (Granger et al., 2020Paul et al., 2017Miczán et al., 2020). All values plotted derive from different taxonomic levels (subclass vs t-type vs cross-area overlap) and must not be interpreted as a single quantitative scale; mouse_homologs_matched in Hodge et al., 2019 reflects cross-species mapping rather than the human type repertoire size; SST “similar diversity” is qualitative and is not plotted; Gouwens 2020 patch-seq cell counts (4,270/2,955/517) are nested filtering tiers and MET-types (28), me-types (26), and t-types (~60) are three different taxonomic hierarchies plotted on separate axes; Yao 2023 cluster counts and Bakken 2021 primate consensus counts are reported on the BICCN whole-brain and primate cortex denominators respectively and not on a single mouse-cortex denominator. Source: hand-extracted values from each atlas’s main text and Tables 1/Fig.1, with cross-area / cross-species denominators annotated above each bar.
📓 Figure code
import matplotlib.pyplot as plt
import matplotlib.patches as mpatches
import numpy as np

plt.rcParams.update({
    'font.family': 'sans-serif', 'font.sans-serif': ['DejaVu Sans','Arial','Helvetica'],
    'axes.spines.top': False, 'axes.spines.right': False, 'figure.dpi': 150,
})

COL = {
    'Vip': '#E63946', 'Sst': '#2A9D8F', 'Pvalb': '#1D3557',
    'Lamp5': '#F4A261', 'Sncg': '#C77DFF', 'Serpinf1': '#8DAA9D',
    'ChAT': '#7B2CBF', 'CR': '#4895EF', 'CCK': '#FB8500', 'subclass': '#264653',
}

fig = plt.figure(figsize=(13, 11))
gs = fig.add_gridspec(2, 2, hspace=0.85, wspace=0.45)

# --- next cell ---

# Panel A — dendrogram of cortical GABAergic taxonomy
axA = fig.add_subplot(gs[0, 0])
axA.set_title('A  Cortical GABAergic taxonomy (Tasic 2018 schema)', loc='left', fontweight='bold')

LEAVES = [
    ('Lamp5',   2.0, 4,  COL['Lamp5'], 'CGE'),
    ('Vip',     1.4, 14, COL['Vip'],   'CGE'),
    ('Sncg',    0.8, 2,  COL['Sncg'],  'CGE'),
    ('Serpinf1',0.2, 1,  COL['Serpinf1'], 'CGE'),
    ('Sst',    -0.8, 14, COL['Sst'],   'MGE'),
    ('Pvalb',  -1.6, 7,  COL['Pvalb'], 'MGE'),
]
CGE_y = [l[1] for l in LEAVES if l[4]=='CGE']
MGE_y = [l[1] for l in LEAVES if l[4]=='MGE']
cge_mid = (max(CGE_y) + min(CGE_y))/2
mge_mid = (max(MGE_y) + min(MGE_y))/2
axA.plot([0.0, 0.0], [mge_mid, cge_mid], color=COL['subclass'], lw=2)
axA.plot([0.0, 0.6], [cge_mid, cge_mid], color=COL['subclass'], lw=2)
axA.plot([0.6, 0.6], [min(CGE_y), max(CGE_y)], color=COL['subclass'], lw=1.4)
axA.plot([0.0, 0.6], [mge_mid, mge_mid], color=COL['subclass'], lw=2)
axA.plot([0.6, 0.6], [min(MGE_y), max(MGE_y)], color=COL['subclass'], lw=1.4)
for name, y, n, color, branch in LEAVES:
    axA.plot([0.6, 1.4], [y, y], color=color, lw=2.2)
    for i in range(n):
        axA.plot([1.4 + i*0.06, 1.4 + i*0.06], [y - 0.07, y + 0.07], color=color, lw=0.9, alpha=0.8)
    axA.text(1.4 + n*0.06 + 0.08, y, f'$\\it{{{name}}}$  ({n})', va='center', fontsize=9, color=color)
axA.text(0.05, max(CGE_y)+0.4, 'CGE', fontsize=11, fontweight='bold', color=COL['subclass'])
axA.text(0.05, min(MGE_y)-0.5, 'MGE', fontsize=11, fontweight='bold', color=COL['subclass'])
axA.text(-0.18, mge_mid + (cge_mid - mge_mid)/2, 'GABAergic\nroot', fontsize=8, ha='right', va='center', color=COL['subclass'])
axA.set_xlim(-0.6, 3.3); axA.set_ylim(-2.4, 2.7); axA.axis('off')
axA.text(-0.5, -2.30, 'Branch widths schematic; tick counts = Tasic 2018 GABAergic types per subclass.',
         fontsize=7.5, color='gray', style='italic')

# --- next cell ---

# Panel B — cross-study VIP type counts (NOT on a common denominator)
axB = fig.add_subplot(gs[0, 1])
axB.set_title('B  Reported cortical $\\it{Vip}$ types across atlases', loc='left', fontweight='bold')

studies = [
    ('Tasic 2016\n(mouse V1)',                5,  't-types',    '#E63946'),
    ('Tasic 2018\n(mouse VISp+ALM)',          14, 't-types',    '#E63946'),
    ('Yao 2021\n(mouse cortex+HPF)',          6,  'supertypes', '#F4A261'),
    ('Hodge 2019\n(human MTG)',               21, 'VIP t-types','#4895EF'),
    ('Lee 2023\n(human cortex Patch-seq)',    45, 'GABA t-types\n(4 subclasses)', '#7B2CBF'),
]
xs = np.arange(len(studies))
heights = [s[1] for s in studies]; colors = [s[3] for s in studies]
labels  = [s[0] for s in studies]; tier   = [s[2] for s in studies]
axB.bar(xs, heights, color=colors, edgecolor='black', linewidth=0.6, width=0.65)
for x, h, t in zip(xs, heights, tier):
    axB.text(x, h + 0.8, f'{h}', ha='center', va='bottom', fontsize=10, fontweight='bold')
    axB.text(x, h + 4.5, t, ha='center', va='bottom', fontsize=6.8, style='italic', color='dimgray')
axB.set_xticks(xs); axB.set_xticklabels(labels, fontsize=7.3, rotation=30, ha='right')
axB.set_ylabel('Reported count'); axB.set_ylim(0, 60)

# --- next cell ---

# Panel C — marker-defined VIP subset frequencies (cross-study ranges)
axC = fig.add_subplot(gs[1, 0])
axC.set_title('C  Marker-defined VIP subset frequencies', loc='left', fontweight='bold')
markers_ = ['VIP/ChAT', 'VIP/CR', 'VIP/CCK']
lo = [3, 25, 25]; hi = [10, 50, 45]; mid = [(l+h)/2 for l,h in zip(lo,hi)]
colors_c = [COL['ChAT'], COL['CR'], COL['CCK']]
y = np.arange(len(markers_))
for i, (l, h, m, c) in enumerate(zip(lo, hi, mid, colors_c)):
    axC.plot([l, h], [i, i], color=c, lw=10, solid_capstyle='round', alpha=0.85)
    axC.plot([m], [i], marker='|', color='black', markersize=14, mew=2)
    axC.text(h + 1.5, i, f'~{l}-{h}%', va='center', fontsize=9.5, color=c, fontweight='bold')
axC.set_yticks(y); axC.set_yticklabels(markers_, fontsize=10)
axC.set_xlabel('% of cortical VIP cells (cross-study range)')
axC.set_xlim(0, 65); axC.set_ylim(-0.7, 2.7); axC.invert_yaxis()
axC.text(0.0, -0.30,
         'Ranges aggregate immunolabel and transcriptomic estimates from\n'
         'Tremblay 2016, Granger 2020, Tasic 2016/2018; tick = midpoint.',
         transform=axC.transAxes, fontsize=7.0, color='gray', style='italic')

# --- next cell ---

# Panel D — schematic of three principal VIP molecular subdivisions
axD = fig.add_subplot(gs[1, 1])
axD.set_title('D  VIP molecular subdivisions and key markers', loc='left', fontweight='bold')
axD.axis('off'); axD.set_xlim(0, 10); axD.set_ylim(0, 10)
axD.add_patch(mpatches.FancyBboxPatch((3.3, 8.1), 3.4, 1.2, boxstyle='round,pad=0.08',
                                       facecolor=COL['Vip'], edgecolor='black', linewidth=0.8, alpha=0.30))
axD.text(5.0, 9.0, 'VIP subclass', fontsize=11, fontweight='bold', ha='center', color=COL['Vip'])
axD.text(5.0, 8.45, '$\\it{Vip}$+ / 5-HT3AR+ / CGE-derived', fontsize=8.5, ha='center')

def box(ax, x, y, w, h, color, title, markers, morph, project):
    ax.add_patch(mpatches.FancyBboxPatch((x, y), w, h, boxstyle='round,pad=0.08',
                                          facecolor=color, edgecolor='black', linewidth=1.0, alpha=0.18))
    ax.text(x + w/2, y + h - 0.35, title, fontsize=10.5, fontweight='bold', ha='center', va='top', color=color)
    ax.text(x + 0.18, y + h - 1.10, 'Markers:', fontsize=8, ha='left', va='top', fontweight='bold')
    ax.text(x + 0.18, y + h - 1.55, markers, fontsize=7.4, ha='left', va='top', style='italic')
    ax.text(x + 0.18, y + h - 3.20, 'Morph: ' + morph, fontsize=7.3, ha='left', va='top')
    ax.text(x + 0.18, y + h - 4.20, 'Targets: ' + project, fontsize=7.3, ha='left', va='top')

box(axD, 0.1, 1.7, 3.0, 6.2, COL['ChAT'], 'VIP / ChAT',
    'Vip, Chat,\nSlc18a3,\nCalb2 (subset)', 'bipolar,\nL2/3-biased', 'L1 INs (ACh)\n+ INs (GABA)')
box(axD, 3.5, 1.7, 3.0, 6.2, COL['CR'], 'VIP / CR',
    'Vip, Calb2 (CR),\nMybpc1,\nCrispld2', 'irregular-spiking\nbipolar', 'SST/CR INs\n(IS-II disinh.)')
box(axD, 6.9, 1.7, 3.0, 6.2, COL['CCK'], 'VIP / CCK',
    'Vip, Cck,\nCnr1, Necab1/2', 'multipolar\nbasket', 'perisomatic\non PCs')
for cx, color in zip([1.6, 5.0, 8.4], [COL['ChAT'], COL['CR'], COL['CCK']]):
    axD.annotate('', xy=(cx, 7.95), xytext=(5.0, 8.05),
                 arrowprops=dict(arrowstyle='->', color=color, lw=1.4))

# --- next cell ---

fig.suptitle('Figure 2.1  VIP within the cortical GABAergic transcriptomic taxonomy',
             fontsize=13, fontweight='bold', y=0.995, x=0.04, ha='left')
fig.savefig('fig_sec2_vip_taxonomy.png', dpi=300, bbox_inches='tight', facecolor='white')
fig.savefig('fig_sec2_vip_taxonomy.pdf', bbox_inches='tight', facecolor='white')
Discrete clusters or continuous gradients within VIP
Having established that VIP subclass identity is robust while t-type counts are not, the deeper methodological question is whether within-VIP heterogeneity is best modelled as a finite set of discrete clusters or as a low-dimensional continuum. Multimodal datasets address this directly. Gouwens et al. (2020) integrated Patch-seq electrophysiology, transcriptomics, and morphology in mouse VISp and defined twenty-eight morphoelectric-transcriptomic (MET) types of cortical GABAergic interneurons, providing a unified framework that reconciled the ~60 t-types and ~26 me-types of preceding atlases by anchoring discrete clusters across modalities. The same dataset showed clean four-way segregation of Lamp5, Vip, Sst, and Pvalb in electrophysiology UMAP space, but within the Vip family — and equivalently within Sst and Pvalb — fine subdivisions were less morpho-electrically separable. Scala et al. (2020) reached a complementary conclusion using Patch-seq on more than 1,300 mouse motor cortex (M1) neurons: broad transcriptomic families (Vip, Pvalb, Sst) had distinct non-overlapping morpho-electric phenotypes, but within-family individual t-types were not well separated in morpho-electric space, suggesting a continuum rather than a discrete partition at the within-VIP level. The same study identified one clear exception — a transcriptomically isolated Vip Lamp5 Lhx6 type morphologically corresponding to deep L5/L6 neurogliaform cells — supporting the existence of locally discrete VIP-related types embedded within an otherwise continuous space.
A second, conceptually orthogonal axis of the discrete-versus-continuous question concerns whether within-VIP/CGE heterogeneity itself reflects discrete cell-type categories or a graded transcriptomic state aligned with brain-wide variables. Bugeon et al. (2022) profiled cortical inhibitory interneurons across V1 layers 1–3 jointly with their in vivo behavioural-state responses and showed that, while neurons remain assignable to a discrete subtype hierarchy (subclasses, types, and subtypes), behavioural-state firing modulation also varies smoothly along a dominant transcriptomic axis that runs across the CGE-derived (Vip/Lamp5/Sncg) compartment, so within-VIP gradients capture meaningful state-response variation that the discrete labels do not by themselves resolve. This continuous-axis interpretation sits in tension with the strictly hierarchical discrete-supertype taxonomy of Yao et al. (2021), in which roughly 1.3 million mouse cortex and hippocampal cells were partitioned into 379 clusters, organised into ~24 GABAergic supertypes, with the Vip subclass yielding six discrete supertypes that are stable to subsampling and well-separated in expression space.
The continuous-versus-discrete distinction is partly a methodological artefact of feature dimensionality and clustering criteria. Tripathy et al. (2018) re-analysed five Patch-seq datasets and found that off-target cell-type mRNA contamination and large variability in mRNA yield were systematic confounds; their marker-gene-based quality scoring improved the correspondence between transcriptome and electrophysiology, narrowing — but not eliminating — apparent within-subclass heterogeneity. Nandi et al. (2022) showed that biophysical models constrained by Patch-seq electrophysiology cluster cleanly by transcriptomic subclass, indicating that ion-channel composition encodes identity at the subclass level even when sub-subclass clustering is unstable. The methodological point is that the within-VIP continuum reported by Scala et al. (2020) and the within-VIP discrete clusters reported by Gouwens et al. (2020) are not mutually exclusive: both are compatible with a model in which the Vip subclass occupies a low-dimensional manifold whose structure can be partitioned into clusters at one threshold and approximated by gradients at another, and on which a small number of transcriptomically isolated outliers (the Vip Lamp5 Lhx6 deep-layer NGCs of Scala et al. (2020), the upper-layer Tac2+/Cxcl14+ population identified across mouse VISp/ALM/MOp by Wu et al. (2022)) form genuinely discrete sub-types.
A separate continuous-gradient signal arises from the laminar dimension. Prönneke et al. (2015) showed that layer II/III VIP cells in mouse barrel cortex differ significantly from layer IV–VI VIP cells in morphology and membrane properties, implying functional rather than purely categorical heterogeneity. Wu et al. (2022) extended this with cross-area transcriptomic comparison, showing that upper-layer (L1–III) and deeper-layer (L4–VI) cortical VIP+ interneurons are transcriptionally distinct, with Tac2 and Cxcl14 emerging as conserved upper-layer marker genes across mouse VISp, ALM, and MOp and detectable in human cortex. Behavioural-state context further refines this map: state-dependent gene-expression analyses applied to interneuron populations in vivo (reviewed in CGE origin and the 5-HT3AR / Adarb2 lineage for developmental context, and revisited in later sections for circuit physiology) reinforce the view that within-VIP molecular heterogeneity is partly continuous along the cortical depth axis. The implication for downstream sections is that any cell-type-level functional claim about “VIP cells” should be qualified by laminar position and cortical area.
Marker-driven labels are not transcriptomic categories
The dominant practical problem in interpreting VIP-related literature is that marker proteins, immunolabels, Cre-driver lines, and scRNA-seq subclasses partition cells differently. The classical immunohistochemical work of Kawaguchi & Kubota (1996), Kawaguchi (1997), and Hájos et al. (1996), together with the laminar census of Staiger et al. (1997) and Staiger et al. (2003) showing that essentially all VIP-immunoreactive interneurons receive PV-basket input and that calbindin-positive interneurons receive symmetric VIP+ contacts, defined “VIP cells” operationally by anti-VIP antibody reactivity. The transcriptomic class label is similar but not identical: Tasic et al. (2018) and Yao et al. (2021) define the Vip subclass by clustered expression of Vip together with several co-expressed markers, with cells that express Vip mRNA at low levels potentially excluded from the cluster. Lee et al. (2010) showed that 5-HT3AR-GFP captures the entire CGE-derived compartment, including not only Vip but also Lamp5 and Sncg subclasses, so a 5-HT3AR-driver phenotype is broader than a Vip-driver phenotype. The most widely used genetic-access tool, the VIP-Cre or VIP-IRES-Cre line Tasic et al., 2018Paul et al., 2017, captures most but not all Vip subclass cells, and may also label transiently Vip-expressing cells from neighbouring CGE subclasses; the off-target risk is most acute at the boundary with Sncg and Lamp5 Tasic et al., 2018Yao et al., 2021. Reported VIP fractions of cortical inhibition therefore depend on which definition is used, with %VIP+ estimates of cortical GABAergic neurons varying across the literature in part because antibody-based, Cre-line, and t-type-based denominators are not equivalent.
A second source of slippage is the marker-defined subdivision within VIP itself. Tremblay et al. (2016)’s synthesis specified VIP/CCK basket cells, VIP/CR irregular-spiking bipolar cells, and a small VIP/ChAT bipolar subset. The molecular evidence supporting VIP/CCK as a coherent unit is now more nuanced: Miczán et al. (2020) showed that NECAB1 and NECAB2 are the predominant calcium-binding proteins of CB1/CCK-positive GABAergic interneurons, closing a long-standing gap in which this large class lacked a typifying calcium-binding protein, in contrast with the calbindin/calretinin signatures of other CCK subsets. The VIP/CR axis maps reasonably well onto the Vip-Mybpc1-related and Vip Crispld2-like t-types of mouse atlases and onto the human VIP/CALB2/TAC3 In1d subpopulation identified by Lake et al. (2017), validating cross-modal identification. The VIP/ChAT axis is more problematic, and we treat it separately below.
The third axis of slippage is laminar and inter-areal. Wu et al. (2022) showed that upper- and deeper-layer cortical VIP+ interneurons are transcriptionally distinguishable; Prönneke et al. (2015) independently showed laminar differences in morphology and intrinsic properties; and the Patch-seq atlases of Gouwens et al. (2020) and Scala et al. (2020) show that the same Vip t-types are not equally sampled across cortical areas. Hostetler et al. (2023) provided a parallel cautionary tale within SST: intersectional Flp/Cre crosses identified two distinct layer-1-targeting SST subtypes with non-overlapping marker expression and electrophysiology, illustrating that even within the dendrite-targeting SST class, marker-defined and intersectional definitions resolve different cell populations. The implication for VIP work is that subdivisions visible in one cortical area may be undersampled or absent in another, and that immunolabel-defined “VIP” cell counts can drift severalfold between studies because the underlying populations being labelled are not identical.
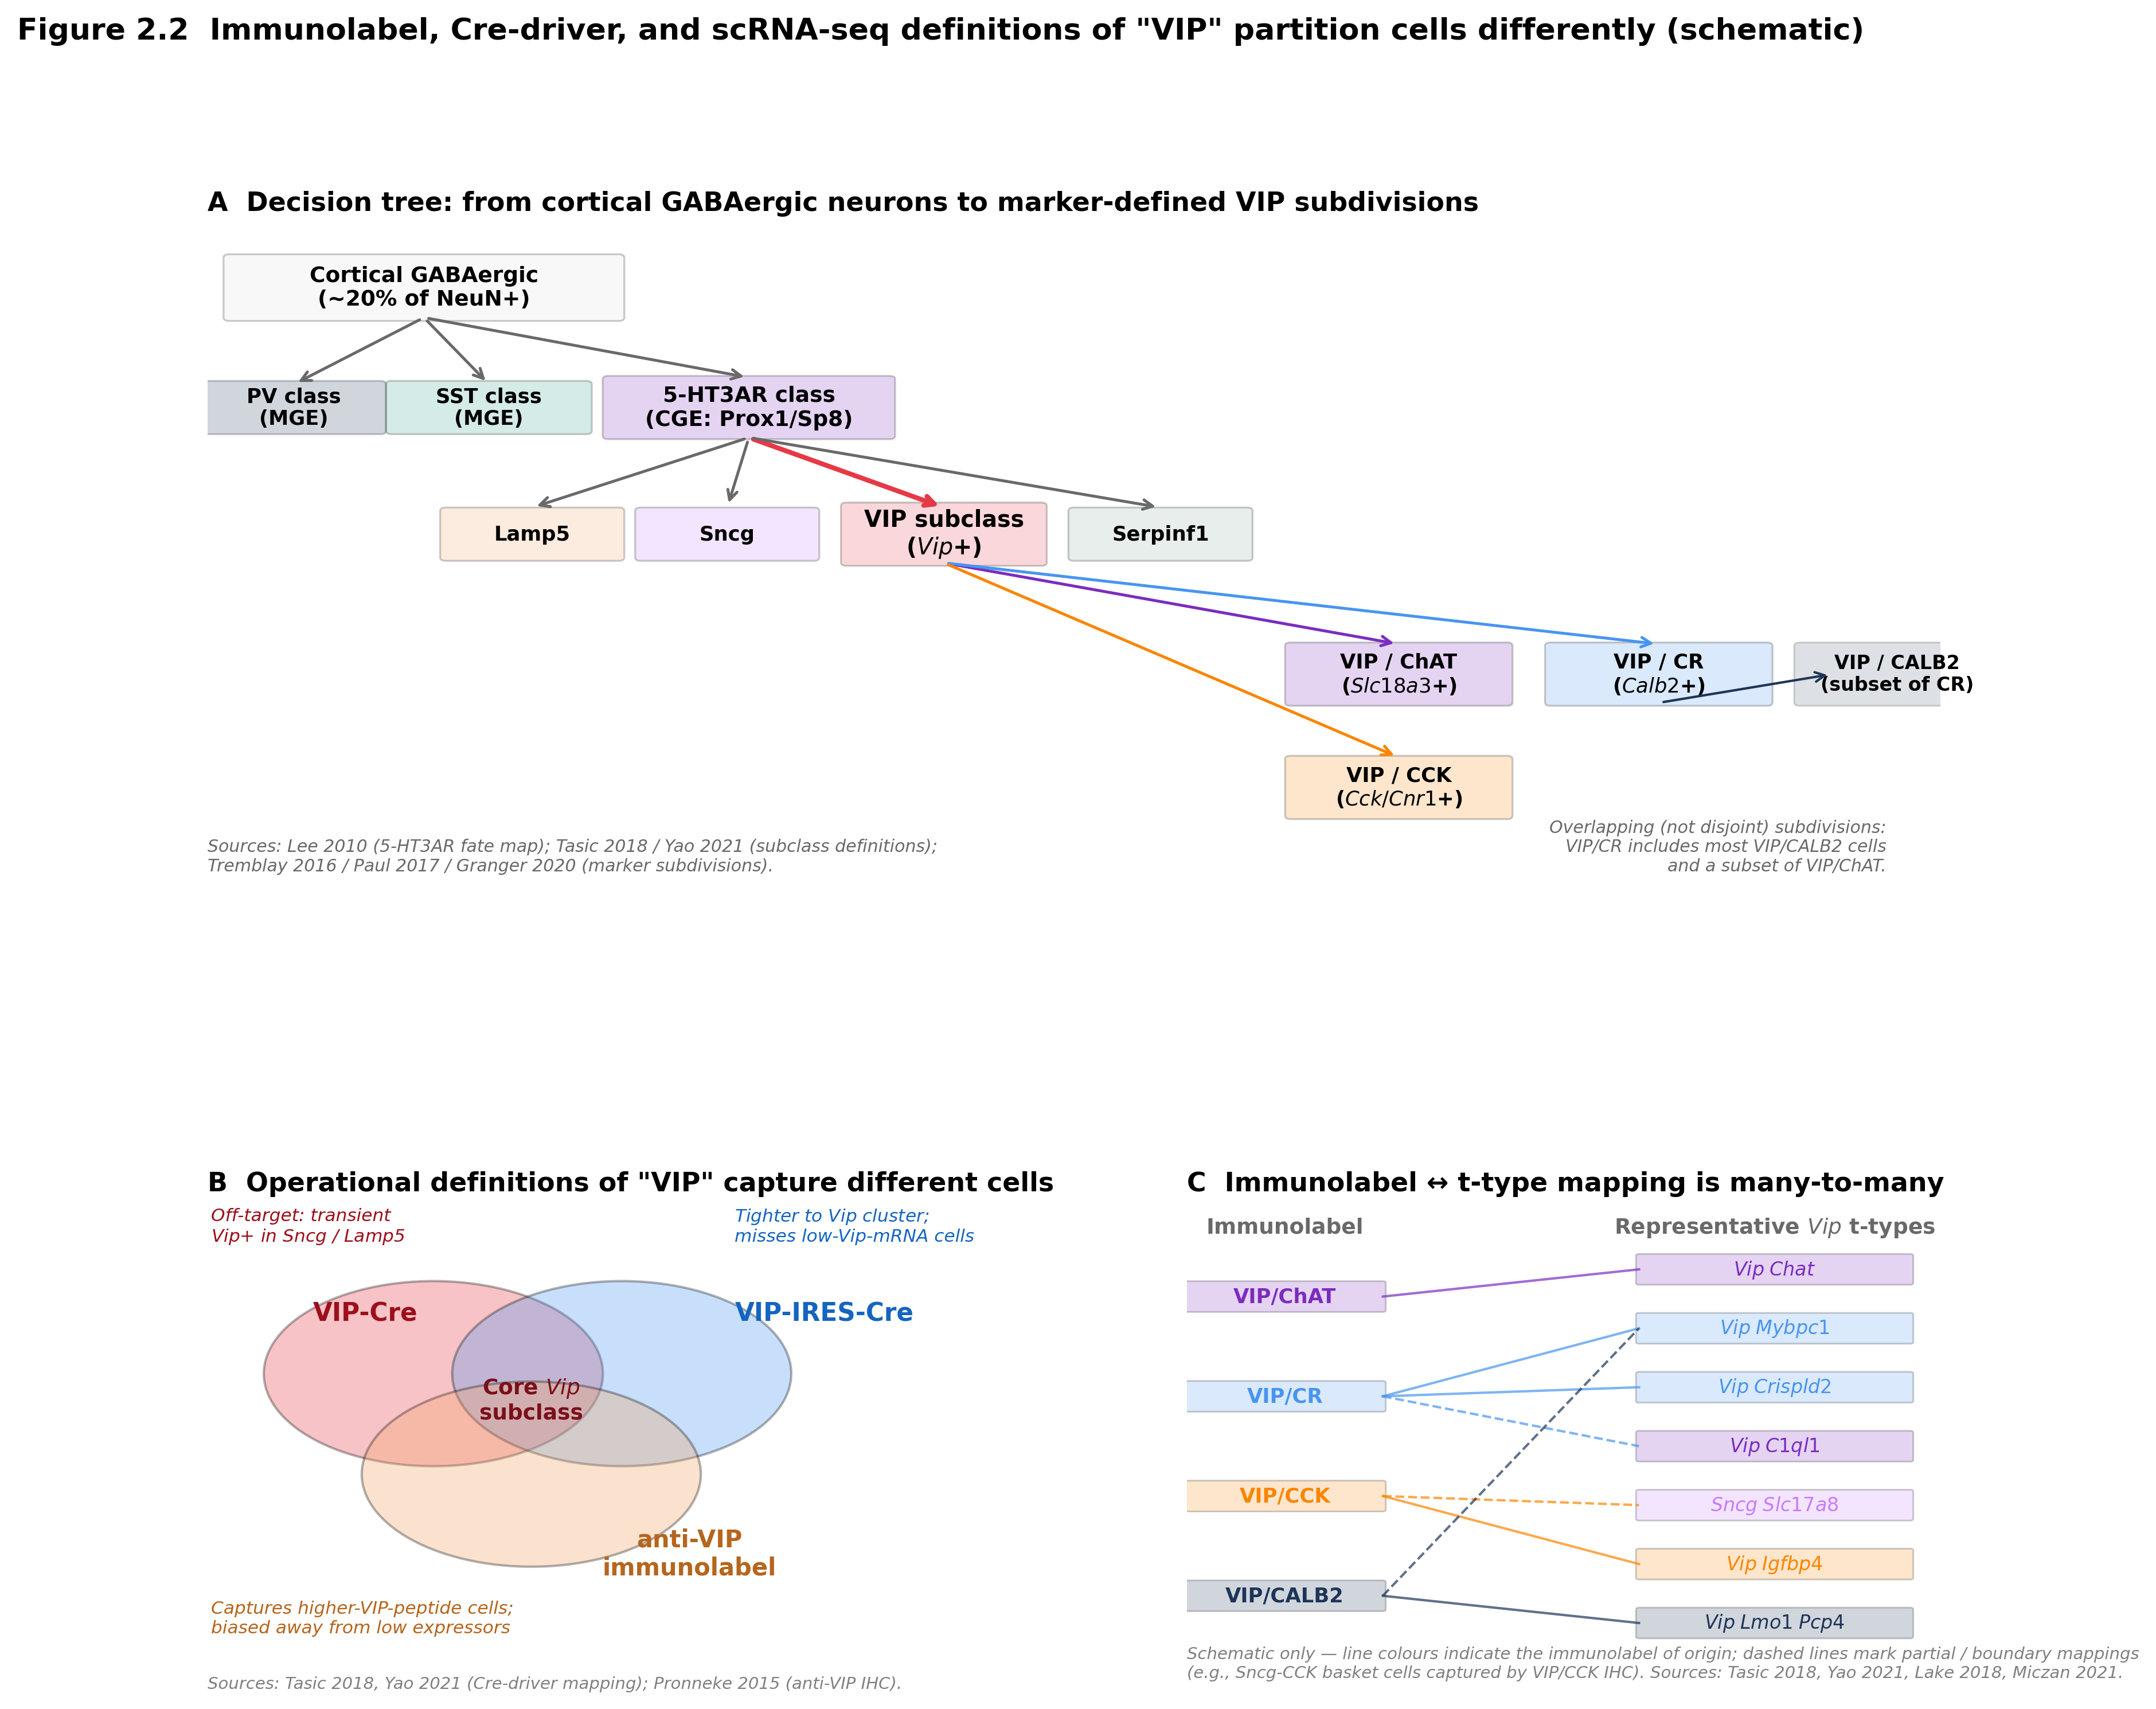
Figure 2:Marker-protein decision tree linking immunolabel-, Cre-driver-, and scRNA-seq-based definitions of “VIP”. (A) From cortical GABAergic neurons (~20% of NeuN+ cortical neurons in mouse Tamamaki et al., 2003) the CGE branch is defined by 5-HT3AR/Prox1/Sp8 expression Lee et al., 2010Tremblay et al., 2016; within the CGE branch, the Vip subclass is defined by clustered expression of Vip and co-markers Tasic et al., 2018Yao et al., 2021. The marker-defined subdivisions VIP/ChAT, VIP/CR, VIP/CCK, and VIP/CALB2 partition the Vip subclass with overlapping rather than disjoint boundaries Tremblay et al., 2016Paul et al., 2017Granger et al., 2020. (B) Schematic Venn comparison of populations captured by VIP-Cre, VIP-IRES-Cre, and anti-VIP immunolabel: Cre-driver populations include most but not all transcriptomically defined Vip cells and may capture transiently Vip-expressing neighbours from Sncg and Lamp5 subclasses; immunolabel captures cells with detectable VIP peptide, biasing toward higher-expressing subsets Tasic et al., 2018Yao et al., 2021Prönneke et al., 2015. (C) Schematic of the immunolabel-to-t-type mapping: VIP/CR maps largely one-to-many onto multiple bipolar Vip t-types and onto human In1d/VIP-CALB2-TAC3 nuclei Lake et al., 2017Tremblay et al., 2016; VIP/CCK maps many-to-many onto Vip t-types overlapping with Sncg CCK-basket-related types Miczán et al., 2020Paul et al., 2017; VIP/ChAT maps approximately one-to-one onto a small bipolar Vip-Chat type that is identified at the t-type level by Tasic et al., 2016Granger et al., 2020 but is not formally labelled cholinergic at the cluster level in larger atlases Yao et al., 2023. This figure is a schematic without quantitative data; it summarises the operational decisions readers must make to compare VIP-related findings across studies that use different definitions, and intentionally does not place numerical estimates on the overlap regions.
📓 Figure code
import matplotlib.pyplot as plt
import matplotlib.patches as mpatches
from matplotlib.patches import FancyBboxPatch, FancyArrowPatch, Ellipse
import numpy as np

plt.rcParams.update({
    'font.family': 'sans-serif', 'font.sans-serif': ['DejaVu Sans','Arial','Helvetica'],
    'axes.spines.top': False, 'axes.spines.right': False, 'figure.dpi': 150,
})

COL = {
    'Vip':'#E63946','Sst':'#2A9D8F','Pvalb':'#1D3557',
    'Lamp5':'#F4A261','Sncg':'#C77DFF',
    'ChAT':'#7B2CBF','CR':'#4895EF','CCK':'#FB8500',
    'Cre':'#264653','IRES':'#0096C7','IHC':'#9D0208',
    'gray':'#6c757d',
}

fig = plt.figure(figsize=(15.5, 8.5))
gs = fig.add_gridspec(1, 3, width_ratios=[1.15, 0.95, 1.25], wspace=0.35)

# --- next cell ---

# Panel A — decision tree
axA = fig.add_subplot(gs[0, 0])
axA.set_title('A  From "GABAergic neuron" to a marker-defined VIP subset',
              loc='left', fontweight='bold')
axA.axis('off'); axA.set_xlim(0, 10); axA.set_ylim(0, 10)

def node(x, y, w, h, label, color='black', face='white'):
    axA.add_patch(FancyBboxPatch((x-w/2, y-h/2), w, h, boxstyle='round,pad=0.08',
                                  facecolor=face, edgecolor=color, linewidth=1.4))
    axA.text(x, y, label, ha='center', va='center', fontsize=9, color=color,
             fontweight='bold')

def edge(x1, y1, x2, y2, label='', color='black'):
    axA.annotate('', xy=(x2, y2), xytext=(x1, y1),
                 arrowprops=dict(arrowstyle='->', color=color, lw=1.2))
    if label:
        axA.text((x1+x2)/2 + 0.15, (y1+y2)/2, label, fontsize=7.5,
                 color=color, style='italic')

node(5.0, 9.3, 4.4, 0.8, 'GAD1/GAD2 + GABAergic', color='#264653', face='#f1faee')
node(2.5, 7.9, 3.4, 0.7, 'CGE-derived (Prox1+/5-HT3AR+)', color=COL['Vip'])
node(7.5, 7.9, 3.4, 0.7, 'MGE-derived (Lhx6+)', color=COL['Sst'])
edge(4.0, 9.0, 2.7, 8.25, color=COL['Vip'])
edge(6.0, 9.0, 7.3, 8.25, color=COL['Sst'])

node(2.5, 6.5, 3.0, 0.7, 'VIP subclass (Vip+)', color=COL['Vip'])
node(7.5, 6.5, 1.6, 0.7, 'Sst', color=COL['Sst'])
node(9.1, 6.5, 1.5, 0.7, 'Pvalb', color=COL['Pvalb'])
node(0.9, 7.0, 1.4, 0.55, 'Lamp5', color=COL['Lamp5'])
node(0.9, 6.2, 1.4, 0.55, 'Sncg', color=COL['Sncg'])
edge(2.5, 7.55, 2.5, 6.85, color=COL['Vip'])
edge(7.5, 7.55, 7.5, 6.85, color=COL['Sst'])
edge(7.5, 7.55, 9.1, 6.85, color=COL['Pvalb'])

# Within VIP — three marker subdivisions
node(1.2, 4.6, 1.9, 0.65, 'VIP / ChAT', color=COL['ChAT'])
node(3.6, 4.6, 1.9, 0.65, 'VIP / CR',   color=COL['CR'])
node(6.0, 4.6, 1.9, 0.65, 'VIP / CCK',  color=COL['CCK'])
edge(2.2, 6.15, 1.4, 4.95, color=COL['ChAT'])
edge(2.5, 6.15, 3.6, 4.95, color=COL['CR'])
edge(2.8, 6.15, 6.0, 4.95, color=COL['CCK'])

# Marker-gene tags below
def mtag(x, y, txt, color):
    axA.text(x, y, txt, ha='center', va='top', fontsize=7.5, style='italic',
             color=color)
mtag(1.2, 4.15, 'Chat / Slc18a3\n+ Calb2 (subset)', COL['ChAT'])
mtag(3.6, 4.15, 'Calb2 / Mybpc1 /\nCrispld2', COL['CR'])
mtag(6.0, 4.15, 'Cck / Cnr1 /\nNecab1/2', COL['CCK'])

# Footer caveat
axA.text(0.2, 1.5,
         'Decision-tree structure is hierarchical at the SUBCLASS level\n'
         '(Tasic 2018; Yao 2023) but many-to-many at the marker / t-type tier.\n'
         'Branch order is illustrative, not phylogenetic.',
         fontsize=7.5, color='gray', style='italic')

# --- next cell ---

# Panel B — Venn schematic: VIP-Cre vs VIP-IRES-Cre vs anti-VIP IHC
axB = fig.add_subplot(gs[0, 1])
axB.set_title('B  Reagents capture overlapping but non-identical populations',
              loc='left', fontweight='bold')
axB.axis('off'); axB.set_xlim(0, 10); axB.set_ylim(0, 10)

# Three overlapping ellipses
e1 = Ellipse((4.2, 5.6), 4.4, 3.0, angle=20,  facecolor=COL['Cre'],  alpha=0.30, edgecolor=COL['Cre'],  linewidth=1.4)
e2 = Ellipse((6.0, 5.6), 4.4, 3.0, angle=-20, facecolor=COL['IRES'], alpha=0.30, edgecolor=COL['IRES'], linewidth=1.4)
e3 = Ellipse((5.1, 4.0), 4.0, 2.6, angle=0,   facecolor=COL['IHC'],  alpha=0.30, edgecolor=COL['IHC'],  linewidth=1.4)
for e in (e1, e2, e3): axB.add_patch(e)

axB.text(2.8, 7.3, 'VIP-Cre',         fontsize=10, fontweight='bold', color=COL['Cre'])
axB.text(7.4, 7.3, 'VIP-IRES-Cre',    fontsize=10, fontweight='bold', color=COL['IRES'])
axB.text(5.1, 1.9, 'anti-VIP IHC',    fontsize=10, fontweight='bold', color=COL['IHC'], ha='center')

# Region annotations
axB.text(5.1, 5.4, 'core\nVIP+',  fontsize=9, ha='center', va='center', fontweight='bold')
axB.text(2.6, 5.6, 'driver-\nspecific',  fontsize=7.5, ha='center', color=COL['Cre'], style='italic')
axB.text(7.6, 5.6, 'driver-\nspecific',  fontsize=7.5, ha='center', color=COL['IRES'], style='italic')
axB.text(5.1, 2.9, 'protein-\ndetected',  fontsize=7.5, ha='center', color=COL['IHC'], style='italic')

axB.text(0.2, 0.6,
         'Driver lines and IHC differ in capture efficiency, leakiness,\n'
         'and developmental window; agreement is partial across regions.',
         fontsize=7.5, color='gray', style='italic')

# --- next cell ---

# Panel C — many-to-many marker-subdivision <-> t-type schematic
axC = fig.add_subplot(gs[0, 2])
axC.set_title('C  Marker subdivisions map many-to-many onto t-types',
              loc='left', fontweight='bold')
axC.axis('off'); axC.set_xlim(0, 10); axC.set_ylim(0, 10)

# Left column: marker subdivisions (3)
markers = [('VIP/ChAT', COL['ChAT'], 7.6),
           ('VIP/CR',   COL['CR'],   5.0),
           ('VIP/CCK',  COL['CCK'],  2.4)]
for name, color, y in markers:
    axC.add_patch(FancyBboxPatch((0.4, y-0.4), 2.2, 0.8, boxstyle='round,pad=0.08',
                                  facecolor=color, edgecolor='black', linewidth=0.9, alpha=0.25))
    axC.text(1.5, y, name, ha='center', va='center', fontsize=10, fontweight='bold', color=color)

# Right column: representative t-type leaves (10) — schematic IDs from Tasic 2018
ttypes = [
    ('Vip Arhgap36 Hmcn1', 9.1),
    ('Vip Lmo1 Fam159b',   8.2),
    ('Vip Crispld2 Htr2c', 7.3),
    ('Vip Crispld2 Kcne4', 6.4),
    ('Vip Lmo1 Myl1',      5.5),
    ('Vip Pygm C1ql1',     4.6),
    ('Vip Igfbp4 Mab21l1', 3.7),
    ('Vip Igfbp6 Pltp',    2.8),
    ('Vip Chat Htr1f',     1.9),
    ('Vip Gpc3 Slc18a3',   1.0),
]
for name, y in ttypes:
    axC.add_patch(FancyBboxPatch((6.7, y-0.32), 3.0, 0.64, boxstyle='round,pad=0.05',
                                  facecolor='white', edgecolor=COL['gray'], linewidth=0.7))
    axC.text(8.2, y, '$\\it{' + name.replace(' ','\\ ') + '}$',
             ha='center', va='center', fontsize=7.6, color='#333333')

# Many-to-many connections (color = source marker; dashed = secondary/partial)
links = [
    ('ChAT', 1.9, 'solid'),  ('ChAT', 1.0, 'solid'),
    ('CR',   8.2, 'solid'),  ('CR',   7.3, 'solid'),  ('CR',   6.4, 'solid'),
    ('CR',   5.5, 'dashed'), ('CR',   2.8, 'dashed'),
    ('CCK',  4.6, 'solid'),  ('CCK',  3.7, 'solid'),  ('CCK',  9.1, 'dashed'),
]
marker_y = {'ChAT':7.6,'CR':5.0,'CCK':2.4}
marker_c = {'ChAT':COL['ChAT'],'CR':COL['CR'],'CCK':COL['CCK']}
for m, ty, style in links:
    ls = '-' if style=='solid' else (0,(3,2))
    alpha = 0.8 if style=='solid' else 0.5
    axC.plot([2.6, 6.7], [marker_y[m], ty], ls=ls, color=marker_c[m], lw=1.2, alpha=alpha)

# Legend
axC.plot([0.4, 1.0], [0.4, 0.4], color='black', lw=1.2)
axC.text(1.1, 0.4, 'primary mapping', va='center', fontsize=7.5)
axC.plot([3.5, 4.1], [0.4, 0.4], color='black', lw=1.2, ls=(0,(3,2)))
axC.text(4.2, 0.4, 'partial / secondary', va='center', fontsize=7.5)

axC.text(0.2, -0.25,
         't-type names from Tasic 2018; selection is illustrative.',
         fontsize=7.0, color='gray', style='italic', transform=axC.transData)

# --- next cell ---

fig.suptitle('Figure 2.2  Marker-based vs. transcriptomic VIP definitions',
             fontsize=13, fontweight='bold', y=1.00, x=0.04, ha='left')
fig.savefig('fig_sec2_marker_tree.png', dpi=300, bbox_inches='tight', facecolor='white')
fig.savefig('fig_sec2_marker_tree.pdf', bbox_inches='tight', facecolor='white')
VIP/ChAT: a discrete subtype that resists cluster-level capture
The VIP/ChAT subset is the prototypical example of how a phenotypically discrete cell can fail to register as a discrete transcriptomic cluster, depending on atlas resolution and labelling thresholds. Tasic et al. (2016) identified Vip-Chat as a discrete t-type uniquely expressing choline acetyltransferase among Vip+ cells in upper cortical layers and confirmed Chat expression by ISH. Granger et al. (2020) then provided the functional validation: nearly all cortical ChAT+ neurons in mouse are specialised VIP+ interneurons that co-release GABA strongly onto inhibitory interneurons and acetylcholine sparsely onto layer-1 interneurons, consistent with the prior physiological observation by Kawaguchi (1997) that cholinergic agonists differentially gate VIP- and SST-class interneurons. Tremblay et al. (2016) and Paul et al. (2017) accordingly treated VIP/ChAT cells as a distinct subset of the VIP class, reporting them as a small fraction of cortical VIP cells.
The complication arose with whole-brain atlases that apply uniform clustering thresholds across many regions. Yao et al. (2023) reported that Slc18a3 (the vesicular acetylcholine transporter) and Chat mRNAs are detected in several clusters within the Vip GABAergic subclass of isocortex, but expression at the cluster level did not cross thresholds for formal labelling as cholinergic, and the whole-brain atlas does not therefore name a “VIP/ChAT” cluster. The most parsimonious reconciliation is that VIP/ChAT cells exist as a phenotypically distinct subtype with target-specific ACh co-release, but their cluster-level transcriptomic separation is subtle relative to the variation across the broader Vip subclass and may not survive threshold-based labelling at the cluster tier in larger atlases. This is the same resolution-dependence noted earlier — the more cells and more brain regions an atlas covers, the more the threshold for “discrete cluster” rises and the more subtle subtypes are absorbed into broader clusters.
The VIP/ChAT case has a wider methodological lesson. The classical IHC literature (Kawaguchi & Kubota (1996)Kawaguchi (1997)Hájos et al. (1996)) repeatedly identified small, regionally biased subtypes — hilar VIP/CR interneuron-selective cells, layer-1-projecting VIP bipolar cells, double-bouquet VIP cells — whose status as transcriptomically discrete t-types is variable across modern atlases. The atlases are not “wrong”; they apply uniform clustering criteria that are calibrated to recover the dominant axes of variation. When a sub-population is small, regionally biased, and defined by graded rather than switch-like differences in marker expression, it is precisely the kind of cell that escapes cluster-level resolution. The atlases of Yao et al. (2021) and Yao et al. (2023) are explicit that supertype and cluster boundaries are projection-method dependent and that finer divisions are recoverable on demand by re-clustering subsets at higher resolution. Bakken et al. (2018) provided complementary methodological evidence that single-nucleus and single-cell RNA-seq capture similar discriminative power for closely related types when intronic reads are retained, ensuring that the resolution limits are biological rather than purely technical.
Cross-species comparison: conservation and divergence
Whether the mouse VIP taxonomy transfers directly to human cortex is a non-trivial empirical question. Hodge et al. (2019) profiled human middle temporal gyrus (MTG) by single-nucleus RNA-seq and identified seventy-five transcriptomic cell types in 15,928 nuclei from eight donors, with VIP the most diverse interneuron subclass at twenty-one types. The same study reported that interneuron-discriminating gene sets were largely conserved between mouse and human, supporting alignment of approximately thirty-seven homologous t-types despite species-specific expression differences. Independently, Lake et al. (2017) used integrative snDrop-seq plus scTHS-seq on more than 60,000 human brain cells to spatially resolve a VIP+/CALB2+/TAC3+ upper-layer interneuron subpopulation (In1d) corresponding to the established VIP/CR class in mouse, validating cross-modal identification of human VIP types. Boldog et al. (2018) then identified the human-specific “rosehip” cortical interneuron in human L1 that does not match any mouse Vip/Sst/Pvalb cluster, while several other human L1 t-types matched mouse Vip+ types — a mixture of conservation and divergence within a single layer.
Mayer et al. (2018), profiling early postmitotic CGE/MGE interneuron precursors in mouse, demonstrated that progenitor-stage transcriptional signatures already segregate into the cardinal cortical interneuron lineages, including a Vip lineage, before terminal differentiation. The cross-species question is then whether human VIP cells share these progenitor-stage transcriptional programs and how the species-specific elaborations identified by Hodge et al. (2019), Boldog et al. (2018), and Lake et al. (2017) map onto the mouse axes. Bakken et al. (2021) directly addressed primate-specific elaboration: more Vip subtype consensus clusters could be resolved by pairwise alignment between human and marmoset M1 than between either primate and mouse, indicating closer homology of VIP types within primates and a divergence step at the rodent–primate split. Bakken et al. (2021) reported a parallel pattern in primate dorsal lateral geniculate nucleus, where GABAergic interneuron diversity is expanded relative to mouse, suggesting species-specific elaboration of inhibitory diversity that may parallel expanded VIP type diversity in primate cortex. Wei et al. (2022) extended the comparative analysis to macaque visual cortex, distinguishing twenty-five excitatory and thirty-seven inhibitory types and reporting in cross-species comparison that glutamatergic neurons may be more diverse across species than GABAergic neurons or non-neuronal cells, consistent with VIP-class identity being conserved at the subclass level while elaborated at the type level. Patch-seq datasets that anchor human transcriptomic types in morpho-electric phenotypes are now available: Lee et al. (2023) reported a human cortex GABAergic taxonomy of forty-five transcriptomic types across four principal interneuron subclasses (PVALB, SST, VIP, LAMP5/PAX6) using Patch-seq with enhancer-AAV labelling for VIP enrichment, and Kalmbach et al. (2021) showed using human neurosurgical Patch-seq that transcriptomically defined L5 extratelencephalic projection neurons have conserved morpho-electric properties between human and rodent, providing a methodological proof of concept for human-rodent cell-type alignment. Chartrand et al. (2023) documented human-specific L1 interneuron transcriptomic types (e.g. VIP PCDH20 and SST BAGE2) homologous to deeper mouse t-types but lacking morphologically equivalent neurons in mouse L1, indicating type-specific divergence rather than the absence of shared subclass identity.
Comparative evidence from non-mammalian vertebrates frames the conservation question on a longer time scale. Tosches et al. (2018) inferred from comparative scRNA-seq of reptile pallia that mammalian neocortical glutamatergic layers represent new cell types built by diversifying ancestral gene-regulatory programs, while diverse cortical interneuron classes already existed in the common amniote ancestor. The implication is that the Vip subclass and its CGE-derived neighbours are an ancient feature of vertebrate cortical inhibition rather than a mammalian innovation, and that the cross-species variability documented by Hodge et al. (2019), Bakken et al. (2021), and Wei et al. (2022) represents elaboration of an old framework rather than wholesale reinvention. Methylome and chromatin data are beginning to support this longer-time-scale view: Liu et al. (2021) generated a single-cell DNA methylation atlas of mouse brain identifying CGE-derived Lamp5 and Vip lineages as epigenomically distinguishable, and Bakos et al. (2025) showed that fast-spiking interneurons in human neocortex possess axon-initial-segment adaptations distinct from rodent FS cells, indicating that even cells with conserved transcriptomic identity can show species-specific elaboration of biophysical properties. The molecular taxonomy of “VIP” is therefore best read as a conserved subclass framework with species-, area-, and laminar-specific elaboration of within-subclass diversity.
Methodological reliability of the taxonomic framework
A useful sanity check is that the multimodal evidence converges on the subclass framework even from preparations that violate standard scRNA-seq assumptions. Bakken et al. (2018) showed that single-nucleus RNA-seq, despite detecting fewer genes per cell than whole-cell scRNA-seq, can discriminate closely related neuronal types when intronic reads are retained — a methodological observation that licenses the use of postmortem human snRNA-seq for cross-species mapping. Crow et al. (2018) independently quantified replicability and found that subclass identity is highly reproducible while fine-grained sub-subclass identity replicates progressively less well, formalising the resolution-dependence anticipated by Tasic et al. (2016) and Tasic et al. (2018). The Patch-seq quality-control work of Tripathy et al. (2018) showed that off-target mRNA contamination from acute slices materially affects within-subclass clustering, and that marker-gene-based quality scoring can be used to filter contaminated cells before clustering. Watanabe et al. (2019) demonstrated that scRNA-seq cell-type catalogues can be coupled to GWAS summary statistics to assign genetic risk to specific neuronal types, an integration that depends on stable subclass labels and motivates further refinement of within-VIP definitions.
The pre-existing electrophysiological taxonomy survives this transcriptomic re-organisation in a graded way. Kawaguchi & Kubota (1996) and Kawaguchi (1997) defined fast-spiking, late-spiking, regular-spiking, and burst-spiking electrophysiological classes that map approximately onto the modern Pvalb, Lamp5 (neurogliaform), Vip/Sst, and Vip (irregular-spiking) classes respectively, with caveats. Kawaguchi (1997) showed that cholinergic agonists differentially gate VIP- and SST-class interneurons but not PV fast-spiking or late-spiking cells, providing one of the earliest neurochemical fingerprints that aligns with modern transcriptomic receptor-expression profiles. Toledo-Rodriguez et al. (2005) recovered seven combinatorial neuropeptide/calcium-binding-protein clusters in juvenile rat S1 that broadly correspond to modern subclasses; Wang et al. (2004) characterised SST/Martinotti laminar specificity that is now integrated into multimodal Sst-Calb2 versus Sst-Chodl distinctions; and Dalezios (2002) showed by EM that essentially all VIP+ GABAergic terminals enriched in mGluR7a target SST/mGluR1α-expressing interneurons, providing direct ultrastructural evidence for the disinhibitory VIP→SST motif at the same time that the molecular markers were being catalogued. The pattern is that classical morphological and electrophysiological subdivisions are recoverable from modern multimodal datasets at the subclass and supertype levels but become harder to map one-to-one at the cluster tier — exactly as the resolution-dependence diagnosis predicts.
Recent atlases have begun to formalise these resolution-dependent statements. Yao et al. (2023)’s whole-brain mouse atlas — thirty-four classes, 338 subclasses, 1,201 supertypes, 5,322 clusters — explicitly proposes that classes and subclasses are stable across regions and methods, supertypes are stable within most regions, and clusters are the level at which dataset- and area-specific structure manifests. Lee et al. (2023) used enhancer-AAV labelling to over-sample VIP cells in human Patch-seq and reported that subclass alignment to mouse VIP holds while type-level alignment requires species-specific subtype definitions, an empirical demonstration of the same hierarchy. The methodological corollary for downstream sections of this review is that mechanistic claims about “VIP cells” should specify whether they are subclass-level (robustly transferable across species and atlases), supertype-level (transferable within species and method), or cluster-level (dataset-specific). The “VIP” used in disinhibitory-circuit experiments is operationally a Cre-driver-defined approximation of the subclass — not a t-type — and most subsequent functional generalisations should be read at that level of resolution.
Bridge to development
The transcriptomic taxonomy this section catalogues has, by construction, taken the adult brain as its starting point: cells were dissociated, sequenced, and clustered, and the resulting groups were named for their dominant marker. The next section (see CGE origin and the 5-HT3AR / Adarb2 lineage) inverts the direction of inquiry. If the Vip subclass and its supertype-level subdivisions are robust at adulthood, where do they come from? Mayer et al. (2018) already showed that the cardinal CGE lineages are pre-specified at progenitor stages by transcriptional signatures; De Marco García et al. (2011) showed that activity-dependent migration before P3 is required for Reelin+ and CR+ CGE-derived interneurons but not for VIP+ interneurons, suggesting differential activity-dependence of subtype maturation; and Frazer et al. (2017) distinguished three main molecular types within developing Htr3a-GFP+ CGE-derived precursors. The developmental section will read these and related findings as the prior to the adult atlas: it will examine how CGE progenitors yield the molecular axes catalogued here, how postnatal maturation refines and sometimes prunes them, and how species-specific lineage logic accounts for the divergence in primate VIP type repertoires reported by Bakken et al. (2021), Hodge et al. (2019), and Wei et al. (2022). The molecular ground truth established in this section therefore serves a dual purpose: it fixes the cell types that the rest of the review will refer to, and it sets the empirical target for the developmental, morphological, electrophysiological, and cross-species accounts that follow.
Section Developmental Origins and Postnatal Maturation traces those identity criteria back through their developmental origins, asking how the gene-regulatory programmes that specify the CGE/5-HT3AR lineage map onto the adult t-type taxonomy laid out here.
- Rudy, B., Fishell, G., Lee, S., & Hjerling-Leffler, J. (2010). Three groups of interneurons account for nearly 100% of neocortical GABAergic neurons. Developmental Neurobiology, 71(1), 45–61. 10.1002/dneu.20853
- Tremblay, R., Lee, S., & Rudy, B. (2016). GABAergic Interneurons in the Neocortex: From Cellular Properties to Circuits. Neuron, 91(2), 260–292. 10.1016/j.neuron.2016.06.033
- Lee, S., Hjerling-Leffler, J., Zagha, E., Fishell, G., & Rudy, B. (2010). The Largest Group of Superficial Neocortical GABAergic Interneurons Expresses Ionotropic Serotonin Receptors. The Journal of Neuroscience, 30(50), 16796–16808. 10.1523/jneurosci.1869-10.2010
- Tamamaki, N., Yanagawa, Y., Tomioka, R., Miyazaki, J.-I., Obata, K., & Kaneko, T. (2003). Green fluorescent protein expression and colocalization with calretinin, parvalbumin, and somatostatin in the GAD67-GFP knock-in mouse. Journal of Comparative Neurology, 467(1), 60–79. 10.1002/cne.10905
- Gonchar, Y. (2008). Multiple distinct subtypes of GABAergic neurons in mouse visual cortex identified by triple immunostaining. Frontiers in Neuroanatomy, 1. 10.3389/neuro.05.003.2007
- Xu, X., Roby, K. D., & Callaway, E. M. (2009). Immunochemical characterization of inhibitory mouse cortical neurons: Three chemically distinct classes of inhibitory cells. Journal of Comparative Neurology, 518(3), 389–404. 10.1002/cne.22229
- Prönneke, A., Scheuer, B., Wagener, R. J., Möck, M., Witte, M., & Staiger, J. F. (2015). Characterizing VIP Neurons in the Barrel Cortex of VIPcre/tdTomato Mice Reveals Layer-Specific Differences. Cerebral Cortex, 25(12), 4854–4868. 10.1093/cercor/bhv202
- Tasic, B., Menon, V., Nguyen, T. N., Kim, T. K., Jarsky, T., Yao, Z., Levi, B., Gray, L. T., Sorensen, S. A., Dolbeare, T., Bertagnolli, D., Goldy, J., Shapovalova, N., Parry, S., Lee, C., Smith, K., Bernard, A., Madisen, L., Sunkin, S. M., … Zeng, H. (2016). Adult mouse cortical cell taxonomy revealed by single cell transcriptomics. Nature Neuroscience, 19(2), 335–346. 10.1038/nn.4216
- Tasic, B., Yao, Z., Graybuck, L. T., Smith, K. A., Nguyen, T. N., Bertagnolli, D., Goldy, J., Garren, E., Economo, M. N., Viswanathan, S., Penn, O., Bakken, T., Menon, V., Miller, J., Fong, O., Hirokawa, K. E., Lathia, K., Rimorin, C., Tieu, M., … Zeng, H. (2018). Shared and distinct transcriptomic cell types across neocortical areas. Nature, 563(7729), 72–78. 10.1038/s41586-018-0654-5
- Yao, Z., Liu, H., Xie, F., Fischer, S., Adkins, R. S., Aldridge, A. I., Ament, S. A., Bartlett, A., Behrens, M. M., Van den Berge, K., Bertagnolli, D., de Bézieux, H. R., Biancalani, T., Booeshaghi, A. S., Bravo, H. C., Casper, T., Colantuoni, C., Crabtree, J., Creasy, H., … Mukamel, E. A. (2021). A transcriptomic and epigenomic cell atlas of the mouse primary motor cortex. Nature, 598(7879), 103–110. 10.1038/s41586-021-03500-8
- Yao, Z., van Velthoven, C. T. J., Nguyen, T. N., Goldy, J., Sedeno-Cortes, A. E., Baftizadeh, F., Bertagnolli, D., Casper, T., Chiang, M., Crichton, K., Ding, S.-L., Fong, O., Garren, E., Glandon, A., Gouwens, N. W., Gray, J., Graybuck, L. T., Hawrylycz, M. J., Hirschstein, D., … Zeng, H. (2021). A taxonomy of transcriptomic cell types across the isocortex and hippocampal formation. Cell, 184(12), 3222-3241.e26. 10.1016/j.cell.2021.04.021
- Yao, Z., van Velthoven, C. T. J., Kunst, M., Zhang, M., McMillen, D., Lee, C., Jung, W., Goldy, J., Abdelhak, A., Aitken, M., Baker, K., Baker, P., Barkan, E., Bertagnolli, D., Bhandiwad, A., Bielstein, C., Bishwakarma, P., Campos, J., Carey, D., … Zeng, H. (2023). A high-resolution transcriptomic and spatial atlas of cell types in the whole mouse brain. Nature, 624(7991), 317–332. 10.1038/s41586-023-06812-z
- Zeisel, A., Muñoz-Manchado, A. B., Codeluppi, S., Lönnerberg, P., La Manno, G., Juréus, A., Marques, S., Munguba, H., He, L., Betsholtz, C., Rolny, C., Castelo-Branco, G., Hjerling-Leffler, J., & Linnarsson, S. (2015). Cell types in the mouse cortex and hippocampus revealed by single-cell RNA-seq. Science, 347(6226), 1138–1142. 10.1126/science.aaa1934
- Zeisel, A., Hochgerner, H., Lönnerberg, P., Johnsson, A., Memic, F., van der Zwan, J., Häring, M., Braun, E., Borm, L. E., La Manno, G., Codeluppi, S., Furlan, A., Lee, K., Skene, N., Harris, K. D., Hjerling-Leffler, J., Arenas, E., Ernfors, P., Marklund, U., & Linnarsson, S. (2018). Molecular Architecture of the Mouse Nervous System. Cell, 174(4), 999-1014.e22. 10.1016/j.cell.2018.06.021
- Crow, M., Paul, A., Ballouz, S., Huang, Z. J., & Gillis, J. (2018). Characterizing the replicability of cell types defined by single cell RNA-sequencing data using MetaNeighbor. Nature Communications, 9(1). 10.1038/s41467-018-03282-0